Trace Monitors
Detect anomalies and regressions across quality, reliability, latency, cost, and classifier outcomes.
Overview
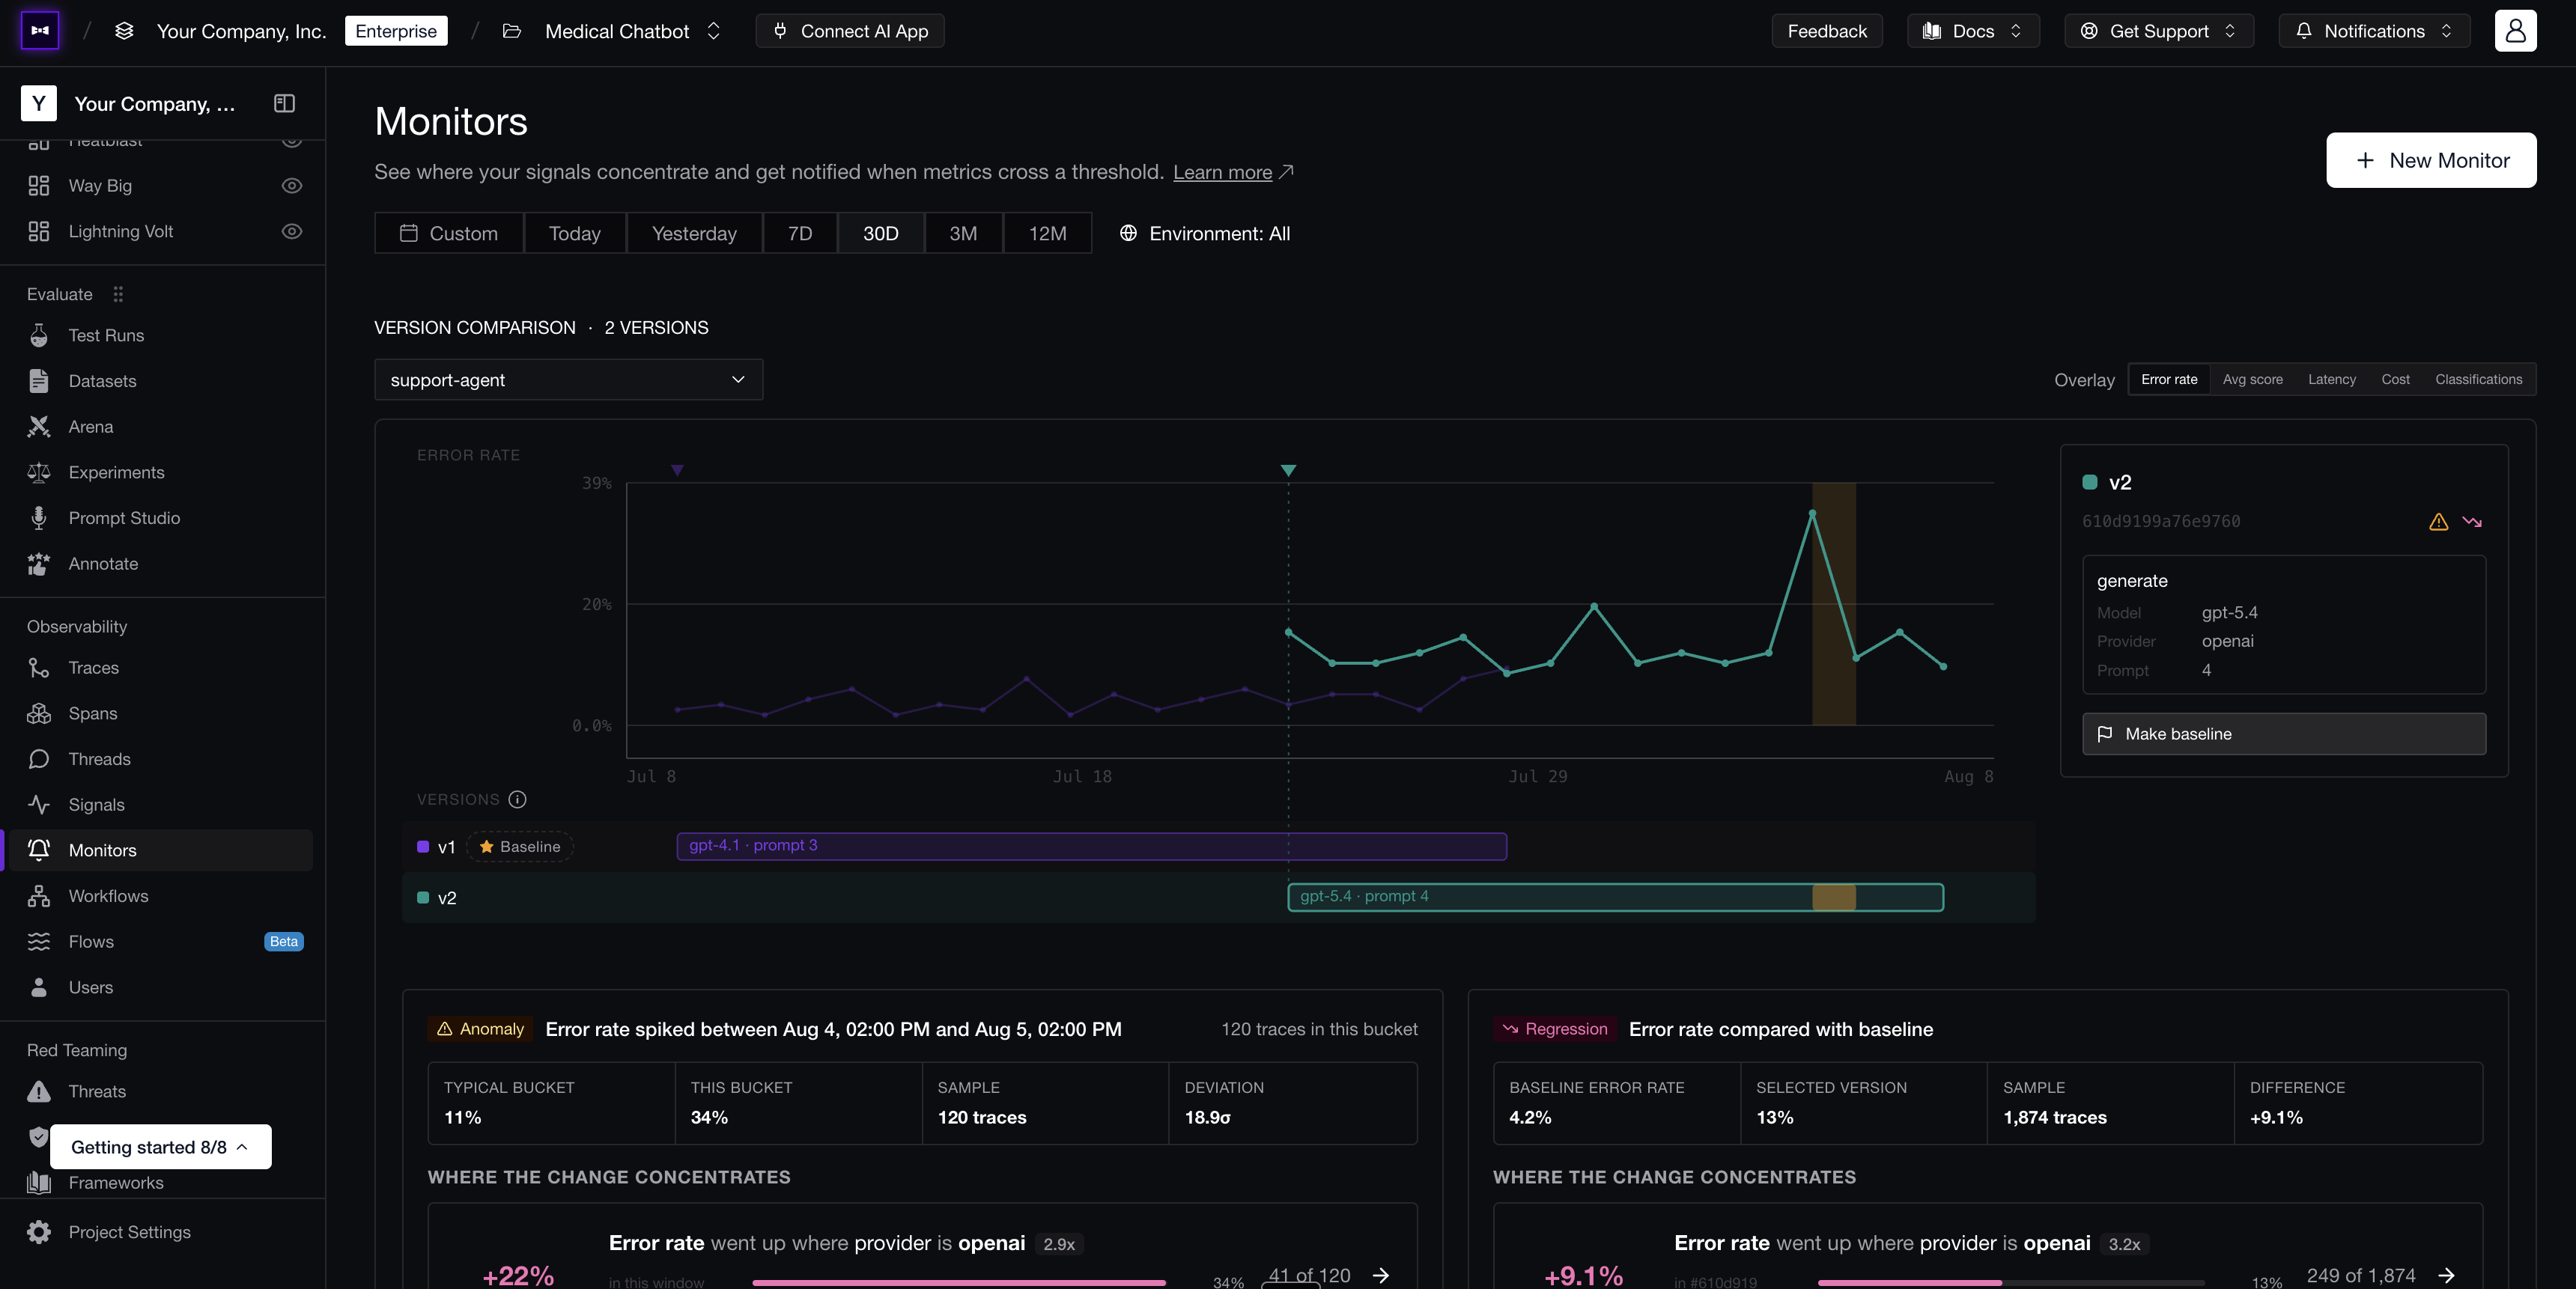
Monitors connect the production behavior of a named trace to the exact AI application configuration that produced it. Instead of treating an error-rate spike, latency increase, cost increase, evaluator-score drop, or negative classifier outcome as an isolated trend, Monitors groups traces into versions and shows when each version was active.
This makes it possible to attribute a change to a specific version, then inspect the models, providers, prompt versions, endpoints, and trace segments that contributed to it. Monitors are designed to answer three questions:
- When did behavior change?
- Which version introduced the change?
- Where is the change concentrated?
Versions
A trace version represents the configuration of your AI application at the time it produced a trace — the models, providers, prompts, and endpoints behind it. Confident AI builds each version from the unique combinations recorded on the trace's LLM spans:
| Field | Description | Example |
|---|---|---|
| Span name | The name of the LLM operation or step within the trace. | generate |
| Model | The model identifier recorded on the LLM span. | gpt-4o |
| Provider | The model provider recorded on the LLM span. | openai |
| Prompt version | The version of the prompt used for the LLM call. | 2 |
| Endpoint | The inference endpoint associated with the LLM call. | /v1/chat/completions |
The combinations are normalized, sorted, and hashed so that the same configuration always produces the same version:
The timeline shows when each version was active. Overlapping lanes mean the versions received traffic during the same period, which makes comparisons less likely to be affected by unrelated changes over time.
The first version observed for a trace becomes its initial baseline. The baseline is the reference used for all version comparisons.
To change it, select another version from the timeline and click Make baseline. Changing the baseline does not modify or reprocess trace data; it only changes which version other versions are compared against.
Choose an overlay above the timeline to inspect:
| Metric | Description | Example |
|---|---|---|
| Error rate | Percentage of traces containing an error. | 2.5% |
| Avg score | Average evaluator score. | 86% |
| Latency | Average trace latency. | 1.2 s |
| Cost | Average trace cost. | $0.0030 |
| Classifications | Percentage of traces carrying at least one enabled trace-classifier label whose polarity is Lower is better. | 8% |
The selected overlay controls the chart, anomaly detection, regression detection, and segment breakdowns. Anomaly and regression detection answer different questions about the selected version:
| Anomaly | Regression | |
|---|---|---|
| Compares | One time bucket against the same version's earlier buckets | The selected version against the baseline version |
| Detects | A sudden change in the version's own behavior | A sustained difference between two versions |
| Scope | A single time bucket | The full selected time range |
Anomaly Detection
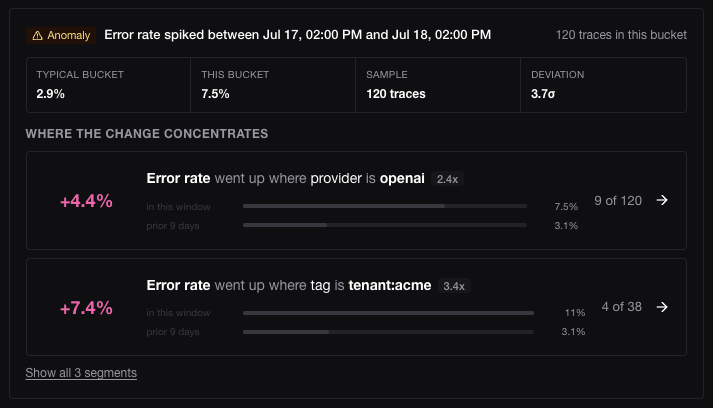
An anomaly is a sudden change in the selected version's own behavior: one time bucket that deviates sharply from that same version's recent history. The baseline version is not involved, so an anomaly tells you when a version started behaving differently, not how it compares to another version.
For the historical bucket values , Confident AI calculates the median:
It then calculates the median absolute deviation:
The current bucket value receives a modified z-score:
A bucket is anomalous when:
At least six eligible historical buckets are required, and each bucket must contain at least 20 traces. If the historical MAD is zero, Confident AI instead requires the current value to differ from the historical median by at least 50%.
The highlighted region on the timeline identifies the exact bucket where the anomaly occurred.
Regression Detection
A regression is a sustained difference between two versions: the selected version performs worse than the baseline across the full selected time range, rather than in any single bucket. Regression detection requires enough traffic to avoid conclusions from very small samples — at least 20 traces on the selected version and 50 traces on the baseline in the selected time range.
For mean metrics such as latency, cost, and evaluator score, a change is considered meaningful when its relative magnitude is at least 10%:
For rate metrics such as error rate and negative classifications, Confident AI compares the underlying proportions and requires statistical significance at .
The direction of the metric determines the result:
- Lower error rate, latency, cost, or negative-classification rate is an improvement
- Higher average evaluator score is an improvement
- The opposite direction is a regression
- A change that does not pass the applicable threshold is shown as No regression detected
Segments
When a meaningful change is found, Monitors searches for the segments where that metric moved most. Segments can include:
| Segment dimension | Description | Example |
|---|---|---|
| Provider | The model provider used by the LLM span. | openai |
| Model | The model used by the LLM span. | gpt-4o |
| Integration | The tracing or framework integration recorded on the span. | langchain |
| Tag | A tag attached to the trace. | beta-users |
| Trace metadata | A key-value metadata field attached to the trace. | region = us-east-1 |
| Embedder | The embedding model used by a retriever span. | text-embedding-3-small |
| Chunk size | The chunk-size configuration recorded on a retriever span. | 512 |
| Top k | The number of results requested by a retriever span. | 10 |
| Classifier label | An individual label, shown only on the Classifications overlay. | Refused to answer |
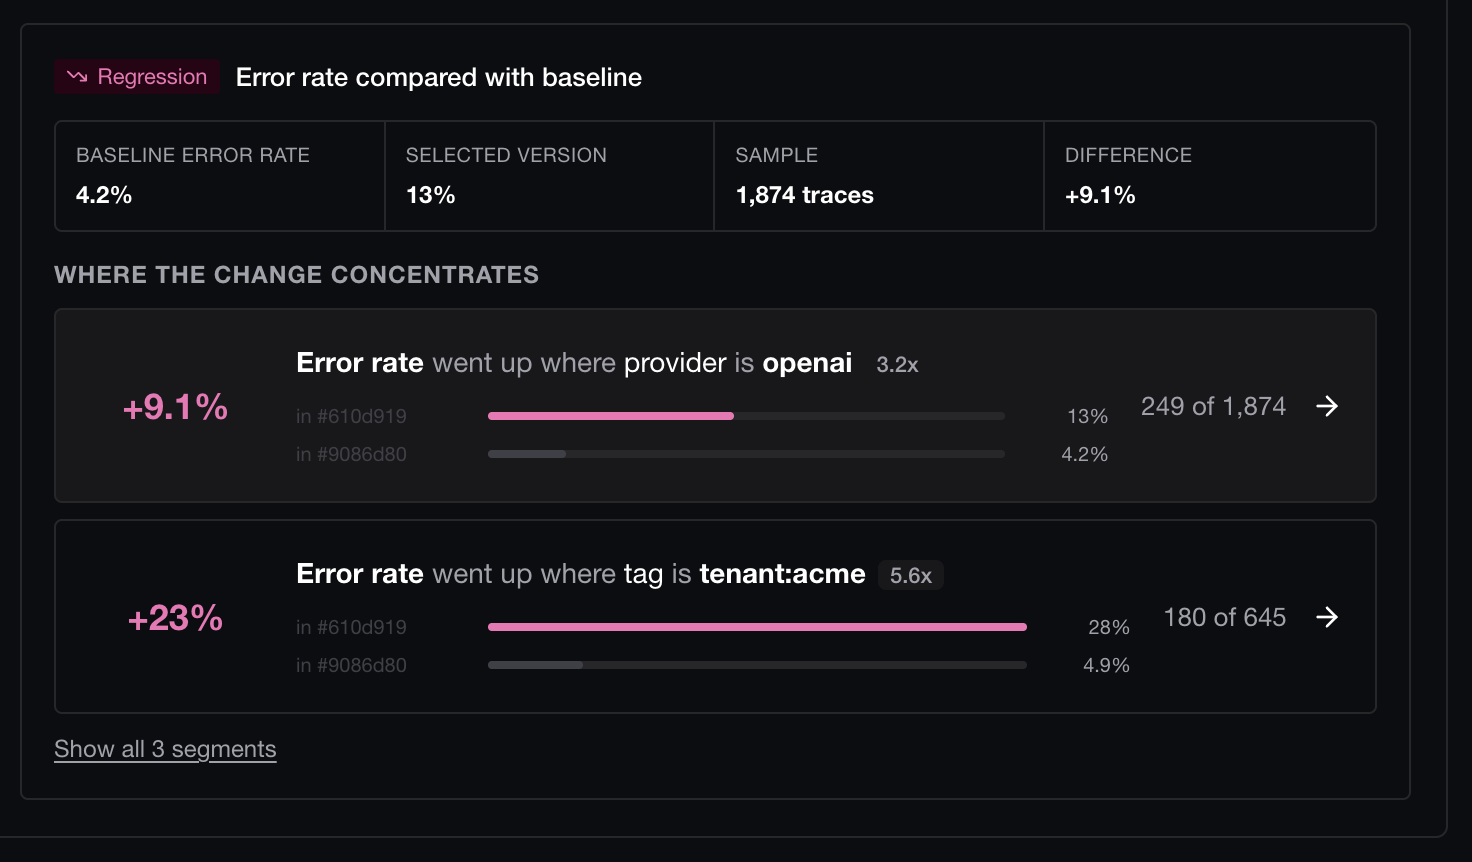
Each row compares the metric inside that segment on both sides of the finding. For an anomaly, the sides are the anomalous bucket and its prior history. For regression, they are the selected and baseline versions.
Segments must have enough traffic and pass the applicable significance or relative-change threshold. Eligible rows are ranked by impact:
This weighting prioritizes changes that affect more traces instead of sorting only by the largest percentage difference. Click a segment row to open the contributing traces with the relevant filters applied.
Alerts
Monitors discover unexpected changes automatically. Alerts evaluate thresholds that you configure and can notify your team on a schedule. After investigating a version change, create an alert when you know the production boundary you want to enforce.
Configure Alerts
Enforce a known production boundary with scheduled threshold checks.
Last updated on