



Failure Modes
Group the traces your classifiers flag into named failure patterns, each with evidence, a suggested fix, and a metric to monitor it.
Overview
Failure Modes are the recurring patterns behind your AI's failures. Each one is written up as a document with what's happening, its impact, the evidence behind it, a suggested fix and a metric to monitor it. Instead of reading every trace your classifiers flag, you get a short list of named problems, such as "Dead Air / Audio Dropout", ranked by severity and tied to the traces that show them.
Open Failure Modes from the project sidebar. The list on the left holds every failure mode in the project, which you can sort and filter by severity and status.
Why Use Failure Modes?
- Read a handful of problems, not hundreds of traces. Flagged traces are grouped into named patterns, ranked by severity, with the quotes that show each one.
- Know what to fix. Every failure mode comes with what's happening, its impact on users and a suggested fix.
- Make sure it stays fixed. Each one suggests a metric, so the same failure is caught automatically from then on.
How Failure Modes Work
Failure modes come from three places: an analysis of the traces your classifiers flagged, Error Analysis of an annotation queue, or one you write yourself. New failure modes start as Needs review. Once you accept one, it becomes Tracked and can be monitored by a metric.
graph TD
    A[Traces] --> B[Classifiers]
    B -->|Less is better labels| C[Generate from traces]
    D[Annotation queues] --> E[Error Analysis]
    C --> F[Failure mode: Needs review]
    E --> F
    G[New Failure Mode] --> H
    F -->|Accept| H[Failure mode: Tracked]
    H --> I[Metric suggestion]
    I -->|Online evaluation| J[Monitoring]

    style A fill:#e1f5fe,color:#1e293b
    style D fill:#e1f5fe,color:#1e293b
    style G fill:#e1f5fe,color:#1e293b
    style B fill:#f3e5f5,color:#1e293b
    style C fill:#f3e5f5,color:#1e293b
    style E fill:#f3e5f5,color:#1e293b
    style F fill:#fff3e0,color:#1e293b
    style H fill:#e8f5e8,color:#1e293b
    style I fill:#e8f5e8,color:#1e293b
    style J fill:#e8f5e8,color:#1e293b
Generate Failure Modes
Generate From Traces
Click Generate from traces at the top of the list to run an analysis. It groups the traces your classifiers flagged by what went wrong, and writes up each group as a failure mode with its sub-patterns and a suggested metric.
Use Generation Settings, next to the button, to choose whether to read traces, spans or threads, the time period, and how many flagged items each run reads.
Scheduled Generation
Use Automatic Generation to generate failure modes on a schedule. Choose how often to check for new flagged traces, and how many must build up before a run starts. Failure modes found this way are highlighted in the list until you open them.
Create a Failure Mode Manually
If you already know a failure you want to track, click New Failure Mode and enter its name, a description of how to recognize it, its severity, and any sub-modes.
A failure mode you create is tracked straight away, but it only holds what you entered: there's no document, evidence or suggested metric until you give it some. To add evidence, tag items with it while annotating in an annotation queue.
Connect Your Codebase
Connecting your codebase doesn't create failure modes. It gives generation context about your AI app, so its results are more accurate.
Use Codebase at the top of the list to connect the GitHub repository with your AI app's code, and optionally the branch and the file your agent starts in. Confident AI reads the code to learn what your app was built to do, so behavior you designed on purpose, such as scripted replies, handoffs or retries, isn't reported as a failure. Failure mode documents can also link to the code behind each failure.
Failure Mode Features
Each failure mode is a document. The header shows its severity, whether it's been reviewed, whether it applies to traces or threads, the metric that monitors it, how often and when it was found, and its sub-patterns.
Below the header are a suggested fix, how to monitor it, what's happening and its impact, the evidence behind it, where it was found, and the traces and spans it shows up in most.
You can edit any section. Click Lock document to keep your edits, or Regenerate document to rewrite it from the latest evidence.
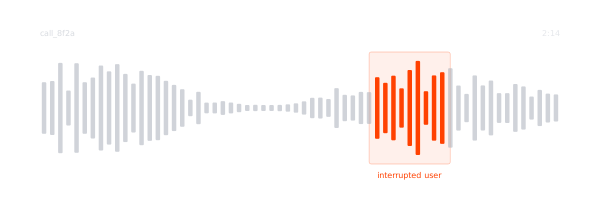
The evidence section explains why the failure happens, then groups the traces and annotations behind it with the quotes that show it. For voice calls, the part of the recording with the issue is marked. Click any item to open it.
Each failure mode suggests a metric to monitor it, and explains why. Depending on the suggestion, click Create metric, Go to metric or Review & update. The failure mode shows Monitoring once that metric runs on your production traces through an online evaluation.
Failure modes and sub-patterns found by an analysis start as Needs review. Click Accept to keep tracking one, or Reject to delete it. A later analysis may suggest a rejected one again. Filter the list by Needs review to see what's waiting.
Next Steps
Signals
See the classifier labels failure modes are generated from.
Error Analysis
Find failure modes in your annotation queues' feedback.
Last updated on