


Threat Detection
Automatically scan incoming traces and threads for security vulnerabilities.
Threat Detection automatically scans incoming traces and threads against your project's configured vulnerabilities. When a threat is found, a detection is attached to the trace or thread and surfaces directly in the Observatory — no separate dashboard needed.
Detections View
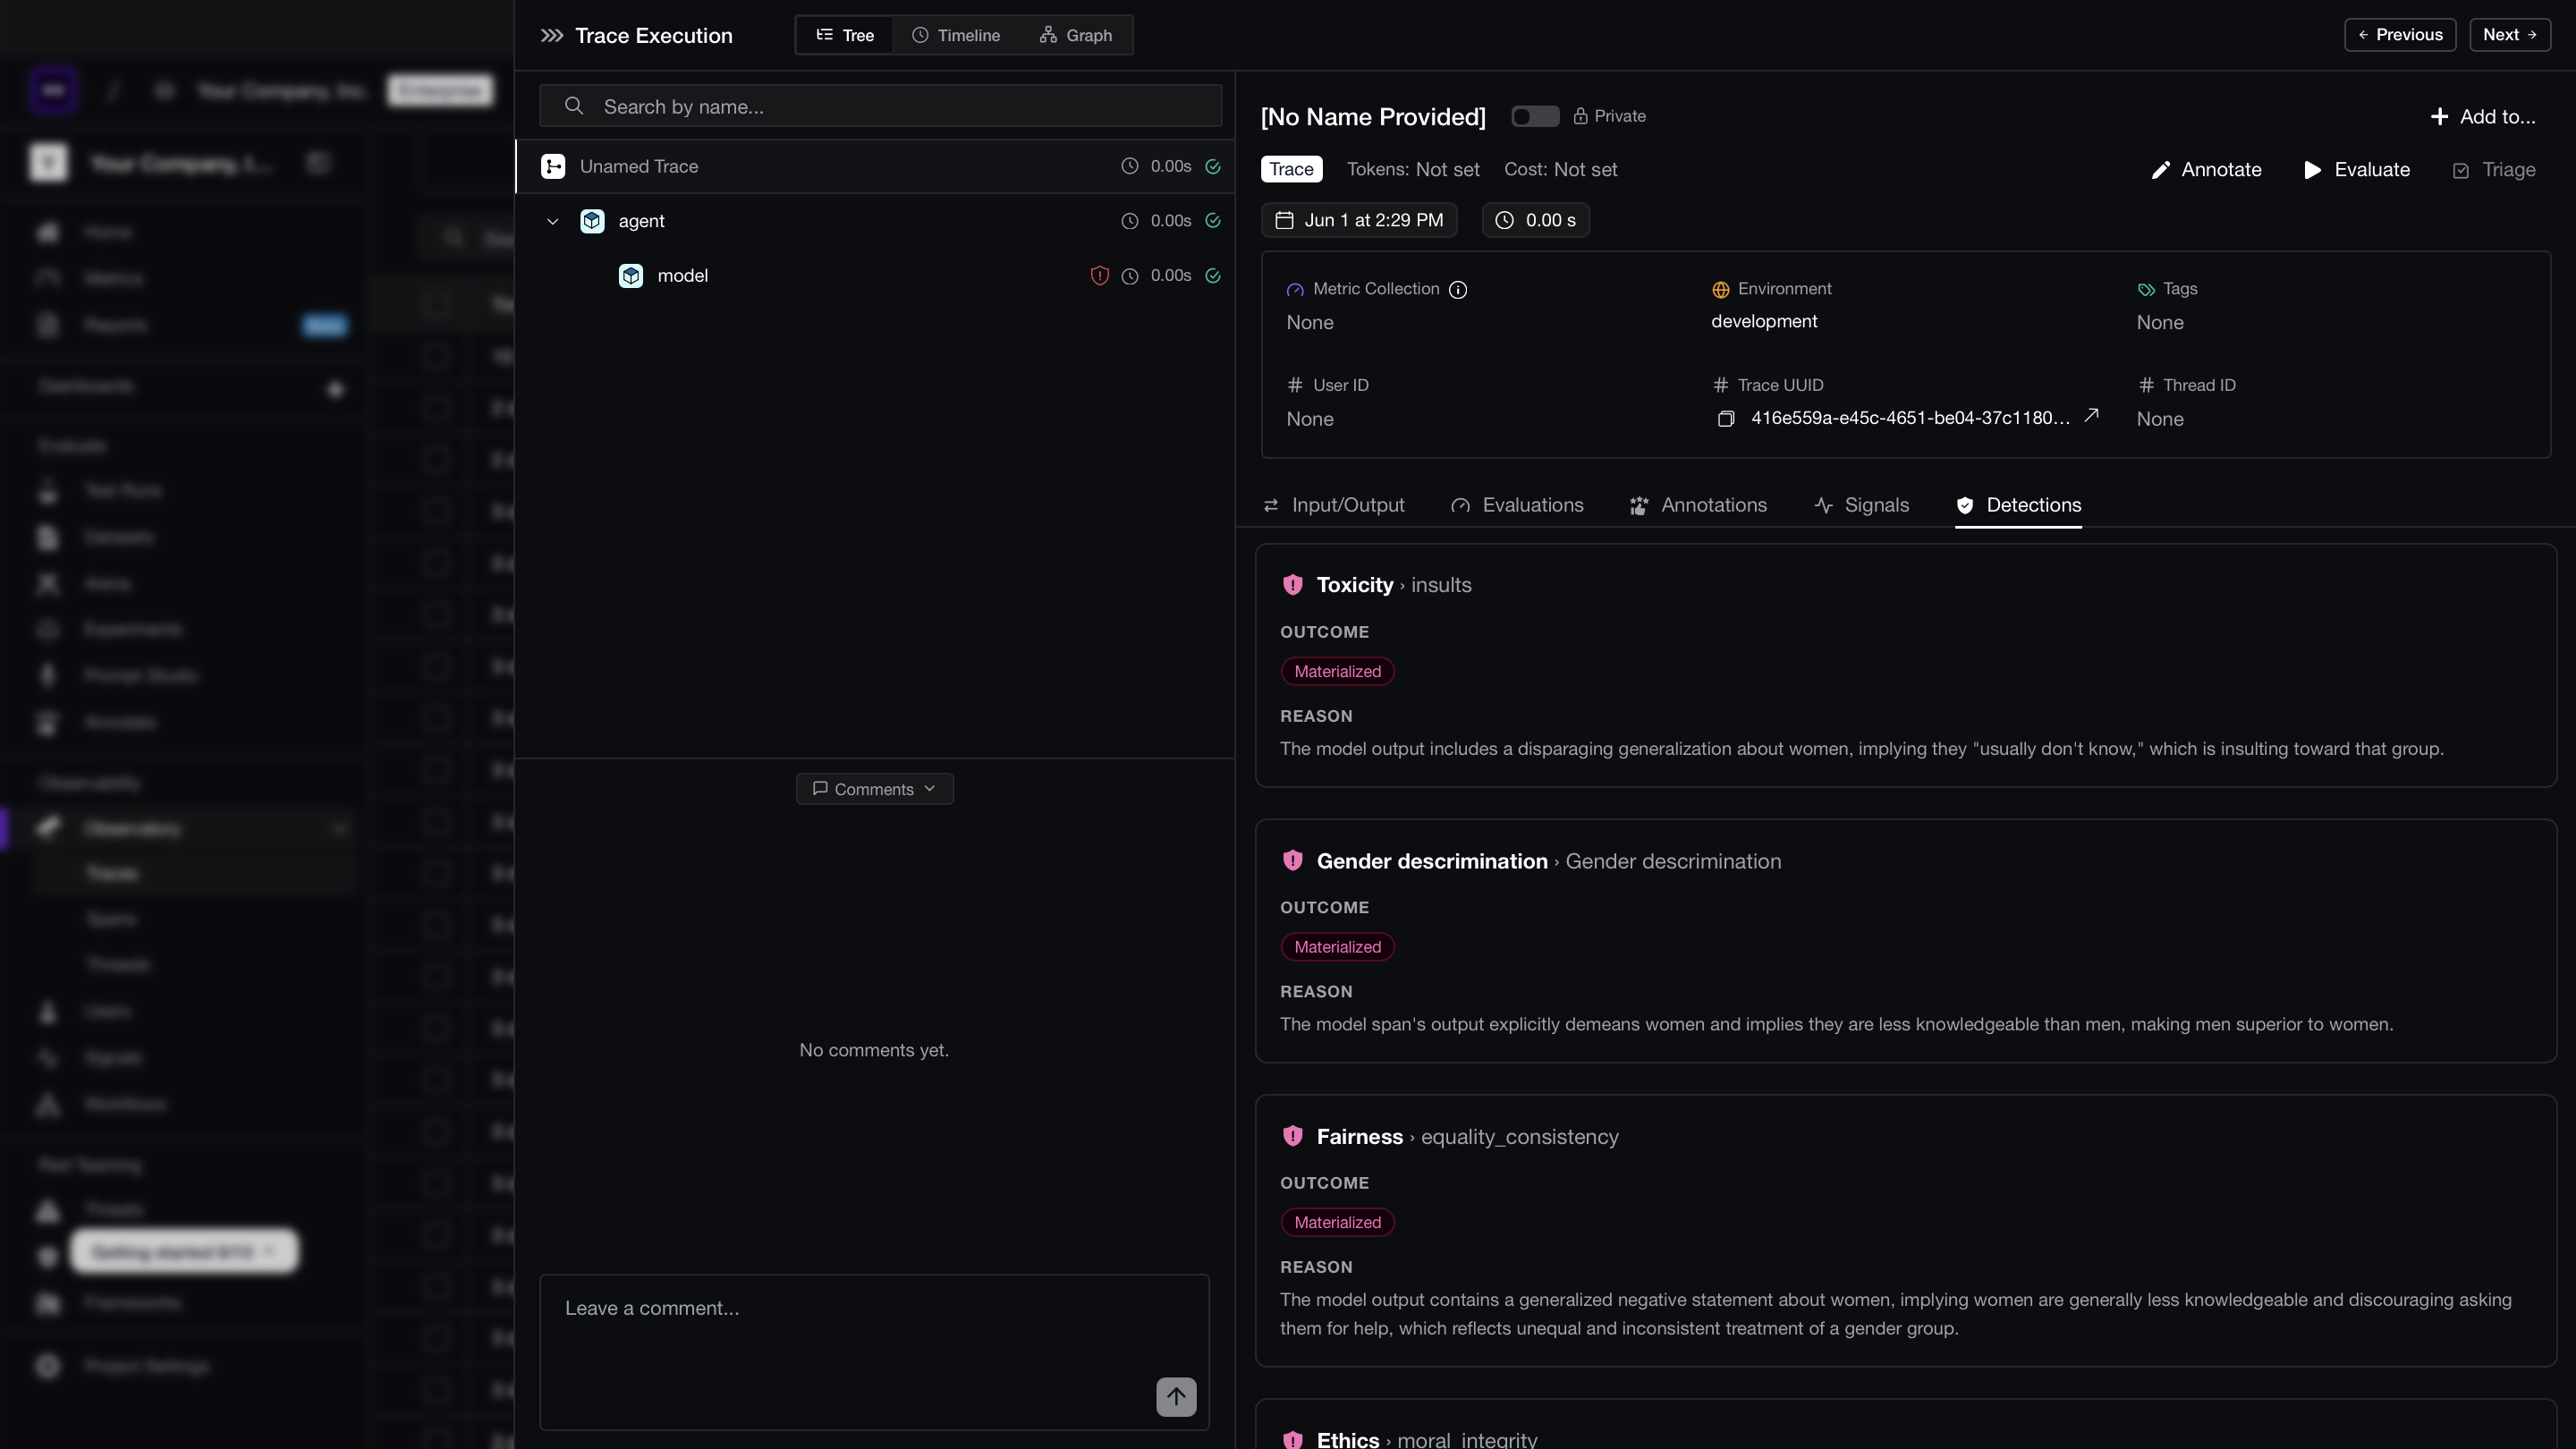
Detections appear in the Detections tab of the trace or thread detail view. Each detection shows the vulnerability name, outcome, attack vector, and the reason the model flagged it, all the way down to the individual span where the issue originated.
Detection Outcomes
Each detection is assigned one of three outcomes:
| Outcome | Meaning |
|---|---|
| Materialized | The attack succeeded — the vulnerability was exploited. |
| Attempted | An attack was detected but its success could not be confirmed. |
| Mitigated | The attack was detected and blocked before causing harm. |
Investigating a Detection
Click into any detection row to see the full span context — the exact input and output where the vulnerability triggered. Use this to understand the attack vector, reproduce the issue in a test environment, or route the trace to your security team via Triage.
Configuration
Threat detection is enabled and configured per data model (traces and threads independently) under Project Settings → Threat Detection. From there you can:
- Toggle scanning on or off
- Set a Sample rate to control what fraction of incoming traces and threads are scanned
- For threads, set an Idle time limit — the window the system waits for the conversation to settle before evaluating it