Link Test Cases to Traces
Link evaluation test cases and turns to their traces for full observability.
Overview
When you run evaluations through an AI Connection, Confident AI can link each result back to the trace your AI app produced. This gives you full observability—jump straight from an evaluation result to the exact trace that generated it.
There are two flavors of trace linking:
- Linking test cases to traces for single-turn evaluations
- Linking turns to traces for multi-turn evaluations and red-team attacks
Both work by passing an identifier (testCaseId or turnId) from your payload into your tracing setup.
Linking Test Cases to Traces
For single-turn evaluations, you can link each test case to its corresponding trace for full observability. This is done by including testCaseId in your payload (enabled by default) and passing it to your tracing setup.
sequenceDiagram
    participant C as Confident AI
    participant E as Your Endpoint
    participant T as Tracing

    C->>E: Ping AI Connection with testCaseId
    E->>T: Create trace with testCaseId
    E-->>C: Return actual_output
    T-->>C: Send trace to Confident AI
    Note over C: Trace linked to test case
Include testCaseId in your payload configuration and ensure your AI connection is configured to accept it.
{
  "input": golden.input,
  "testCaseId": testCaseId
}
Then, pass the testCaseId to your tracing implementation:
from deepeval.tracing import observe, update_current_trace

@observe()
def llm_app(input: str, test_case_id: str):
    update_current_trace(test_case_id=test_case_id)

    response = llm.generate(user=input)
    return response

@app.post("/generate")
def generate(request: dict):
    test_case_id = request.get("testCaseId")
    response = llm_app(request["input"], test_case_id)
    return {"output": response}
import OpenAI from "openai";
import { instrumentOpenAI } from "deepeval/openai";
import { setTracingContext } from "deepeval/tracing";
const client = new OpenAI();
instrumentOpenAI(client);
const main = async () => {
await setTracingContext(
{
testCaseId: "tc_123"
},
async () => {
const response = await client.chat.completions.create({
model: "gpt-4o",
messages: [
{ role: "system", content: "You are a helpful assistant." },
{ role: "user", content: "What is the weather in France?" },
],
});
console.log(response);
}
);
};
main();from langchain.agents import create_tool_calling_agent, AgentExecutor
from deepeval.integrations.langchain import CallbackHandler
...
@app.post("/generate")
def generate(request: dict):
test_case_id = request.get("testCaseId")
result = agent_executor.invoke(
{"input": request["input"]},
config={"callbacks": [CallbackHandler(test_case_id=test_case_id)]}
)
return {"output": result["output"]}from langgraph.prebuilt import create_react_agent
from deepeval.integrations.langchain import CallbackHandler
...
@app.post("/generate")
def generate(request: dict):
test_case_id = request.get("testCaseId")
result = agent.invoke(
{"messages": [{"role": "user", "content": request["input"]}]},
config={"callbacks": [CallbackHandler(test_case_id=test_case_id)]}
)
return {"output": result["messages"][-1].content}@app.post("/generate")
def generate(request: dict):
test_case_id = request.get("testCaseId")
with tracer.start_as_current_span("llm_app") as span:
span.set_attribute("confident.trace.test_case_id", test_case_id)
response = llm.generate(user=request["input"])
return {"output": response}import { generateText } from "ai";
const { text } = await generateText({
model: "openai/gpt-4o",
prompt: "How to make the best coffee?",
experimental_telemetry: {
isEnabled: true,
metadata: {
testCaseId: "tc_123",
}
},
});
console.log(text);import os
from openinference.instrumentation.langchain import LangChainInstrumentor
from langchain_openai import ChatOpenAI
from deepeval.integrations.openinference import instrument_openinference
LangChainInstrumentor().instrument()
instrument_openinference(
test_case_id="tc_123",
)
llm = ChatOpenAI(model="gpt-4o-mini")
result = llm.invoke("What are LLMs?")import { instrumentOpenInference } from "deepeval/integrations/openinference";
import { registerInstrumentations } from "@opentelemetry/instrumentation";
import { OpenAIInstrumentation } from "@arizeai/openinference-instrumentation-openai";
instrumentOpenInference({
testCaseId: "tc_123",
});
registerInstrumentations({
instrumentations: [new OpenAIInstrumentation()],
});
async function main() {
const { default: OpenAI } = await import("openai");
const client = new OpenAI();
await client.chat.completions.create({
model: "gpt-4o-mini",
messages: [{ role: "user", content: "What is OpenInference?" }],
});
}Linking Turns to Traces
For multi-turn evaluations and multi-turn red-team attacks, Confident AI calls your endpoint once per turn. Each turn has its own turnId that you can pass to your tracing setup. This links each turn's trace to the specific turn in the conversation, letting you view traces per-turn from the evaluation or assessment results.
sequenceDiagram
    participant C as Confident AI
    participant E as Your Endpoint
    participant T as Tracing

    Note over C,E: Turn 1
    C->>E: { turnId, ...payload }
    E->>T: Create trace with turnId
    E-->>C: Return actual_output

    Note over C,E: Turn 2
    C->>E: { turnId, ...payload }
    E->>T: Create trace with turnId
    E-->>C: Return actual_output

    T-->>C: Send traces to Confident AI
    Note over C: Each turn linked to its trace
Include turnId in your payload configuration:
{
  "input": golden.input,
  "turnId": turnId,
  "state": state
}
Then, pass the turnId to your tracing implementation:
from deepeval.tracing import observe, update_current_trace

@observe()
def llm_app(input: str, turn_id: str):
    update_current_trace(turn_id=turn_id)

    response = llm.generate(user=input)
    return response

@app.post("/generate")
def generate(request: dict):
    turn_id = request.get("turnId")
    response = llm_app(request["input"], turn_id)
    return {"output": response}
import OpenAI from "openai";
import { instrumentOpenAI } from "deepeval/openai";
import { setTracingContext } from "deepeval/tracing";
const client = new OpenAI();
instrumentOpenAI(client);
const main = async () => {
await setTracingContext(
{
turnId: "turn_123"
},
async () => {
const response = await client.chat.completions.create({
model: "gpt-4o",
messages: [
{ role: "system", content: "You are a helpful assistant." },
{ role: "user", content: "What is the weather in France?" },
],
});
console.log(response);
}
);
};
main();from langchain.agents import create_tool_calling_agent, AgentExecutor
from deepeval.integrations.langchain import CallbackHandler
...
@app.post("/generate")
def generate(request: dict):
turn_id = request.get("turnId")
result = agent_executor.invoke(
{"input": request["input"]},
config={"callbacks": [CallbackHandler(turn_id=turn_id)]}
)
return {"output": result["output"]}from langgraph.prebuilt import create_react_agent
from deepeval.integrations.langchain import CallbackHandler
...
@app.post("/generate")
def generate(request: dict):
turn_id = request.get("turnId")
result = agent.invoke(
{"messages": [{"role": "user", "content": request["input"]}]},
config={"callbacks": [CallbackHandler(turn_id=turn_id)]}
)
return {"output": result["messages"][-1].content}@app.post("/generate")
def generate(request: dict):
turn_id = request.get("turnId")
with tracer.start_as_current_span("llm_app") as span:
span.set_attribute("confident.trace.turn_id", turn_id)
response = llm.generate(user=request["input"])
return {"output": response}import { generateText } from "ai";
const { text } = await generateText({
model: "openai/gpt-4o",
prompt: "How to make the best coffee?",
experimental_telemetry: {
isEnabled: true,
metadata: {
turnId: "turn_123",
}
},
});
console.log(text);import os
from openinference.instrumentation.langchain import LangChainInstrumentor
from langchain_openai import ChatOpenAI
from deepeval.integrations.openinference import instrument_openinference
LangChainInstrumentor().instrument()
instrument_openinference(
turn_id="turn_123",
)
llm = ChatOpenAI(model="gpt-4o-mini")
result = llm.invoke("What are LLMs?")import { instrumentOpenInference } from "deepeval/integrations/openinference";
import { registerInstrumentations } from "@opentelemetry/instrumentation";
import { OpenAIInstrumentation } from "@arizeai/openinference-instrumentation-openai";
instrumentOpenInference({
turnId: "turn_123",
});
registerInstrumentations({
instrumentations: [new OpenAIInstrumentation()],
});
async function main() {
const { default: OpenAI } = await import("openai");
const client = new OpenAI();
await client.chat.completions.create({
model: "gpt-4o-mini",
messages: [{ role: "user", content: "What is OpenInference?" }],
});
}Next Steps
With traces linked to your evaluation results, you can debug failures end-to-end. Explore related observability and connection features next.
Multi-Turn State
Persist information across turns during multi-turn simulations.
LLM Tracing
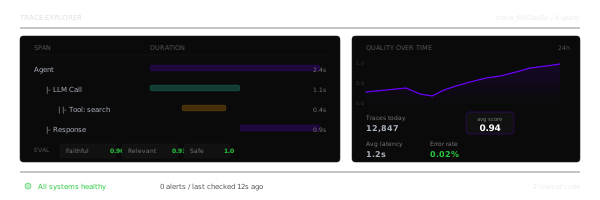
Learn how tracing works across your AI app.
Last updated on