Build Test Runs from Traces
Open a test run, stream your app's traces into it as test cases, and let Confident AI evaluate each one at the trace and component level.
Overview
Before you ship a change, you want to know your app still clears the bar — that no regression is slipping through to production. That's what a test run is for: a batch of test cases, each evaluated by the metrics you care about, with one pass-or-fail read at the end. This guide builds one from something your app already produces on every request — its traces.
The whole idea fits in one sentence: point a trace at an open test run, and it becomes an evaluated test case. Confident AI scores it against your metrics, files it under the run, and closes the run out when the last case lands.
Traces reach Confident AI two ways — over the API or through OpenTelemetry — so you can build a run in your most comfortable stack.
graph LR
    T["Your app's traces"] --> R["An open<br/>test run"]
    R --> TC["Each trace becomes<br/>an evaluated test case"]
    TC --> Res["Pass / fail read<br/>before you ship"]

    style R fill:#eef2ff,stroke:#6366f1
    style TC fill:#eef2ff,stroke:#6366f1
    style Res fill:#eef2ff,stroke:#6366f1
In this guide, you will:
- Open a test run and capture your traces as test cases inside this run.
- Send traces with the run id and a metric collection to evaluate them on cloud and automatically convert them to test cases.
- Evaluate the steps inside each trace — the retriever, the LLM call — not just the final answer with component level evals.
- Send test cases over OpenTelemetry with span attributes, for users who already have instrumentation in place.
By the end, you'll have a repeatable way to benchmark quality before every release, built entirely from your app's traces.
Prerequisites
Two things need to exist before your first test case lands:
- A Project API Key —
CONFIDENT_API_KEY(e.g.confident_us_proj_...). Retrieve yours here. - A single-turn metric collection in your project. This is what "good" means for your test cases — pass rates, quality thresholds, the metrics you'd gate a release on. You'll refer to it by name, so note the exact name.
Send Traces via the API
Each step calls the Confident API — every snippet links straight to its reference, where you can try the call live. Prefer to instrument with OpenTelemetry instead? The OpenTelemetry section covers the same flow.
Open a test run
Start by opening an empty run. Confident AI hands back an
id, and the run stays in progress — ready to take in test cases — until you're done sending.POST/v1/test-runs curl -X POST "https://api.confident-ai.com/v1/test-runs" \ -H "CONFIDENT_API_KEY: <PROJECT-API-KEY>" \ -H "Content-Type: application/json" \ -d '{ "identifier": "my-test-run", "metricCollection": "Agent Quality" }'Both fields are optional.
identifieris a label so you can find the run again later;metricCollectionsets a default collection for any case that doesn't name its own. You get back the run'sidand alinkto it on the platform:Response { "success": true, "data": { "id": "<TEST-RUN-ID>" }, "link": "https://app.confident-ai.com/project/<PROJECT-ID>/test-runs/<TEST-RUN-ID>", "deprecated": false }Hold onto that
id— every trace you send as a test case carries it.Send a trace as a test case
Now send a trace with the run's
idas itstestRunId. That single field is what turns an ordinary trace into a test case: Confident AI pulls it into the run, evaluates it, and files the result. The metric collection that evaluates it either rides on the trace — as below — or falls back to the run's default.POST/v1/traces curl -X POST "https://api.confident-ai.com/v1/traces" \ -H "CONFIDENT_API_KEY: <PROJECT-API-KEY>" \ -H "Content-Type: application/json" \ -d '{ "uuid": "<TRACE-UUID>", "input": "What is the capital of France?", "output": "The capital of France is Paris.", "startTime": "2025-01-15T10:30:00Z", "endTime": "2025-01-15T10:30:05Z", "testRunId": "<TEST-RUN-ID>", "metricCollection": "Collection Name", "baseSpans": [ { "uuid": "<SPAN-UUID>", "name": "Agent", "input": "What is the capital of France?", "output": "Let me look that up for you.", "startTime": "2025-01-15T10:30:00Z", "endTime": "2025-01-15T10:30:02Z" } ] }'Its
inputandoutputare what the trace-level metrics evaluate — what your app was asked, and how it answered — whileuuid,name,startTime, andendTime(ISO-8601) round it out. That's a complete test case.Evaluate the steps inside the trace
A trace-level score tells you the final answer was good. It doesn't tell you why — or, when the answer is wrong, which step let you down. Was it the retriever that pulled the wrong context, or the model that ignored the right one?
To answer that, you can evaluate your spans by giving each one its own
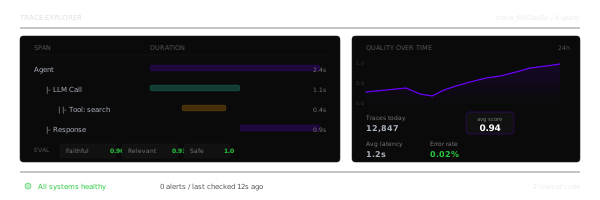
metricCollection. Each span is a component, evaluated on its own and can be seen in the Observatory or the test case's trace view.POST/v1/traces curl -X POST "https://api.confident-ai.com/v1/traces" \ -H "CONFIDENT_API_KEY: <PROJECT-API-KEY>" \ -H "Content-Type: application/json" \ -d '{ "uuid": "<TRACE-UUID>", "input": "What is the capital of France?", "output": "The capital of France is Paris.", "startTime": "2025-01-15T10:30:00Z", "endTime": "2025-01-15T10:30:05Z", "testRunId": "<TEST-RUN-ID>", "metricCollection": "Collection Name", "retrieverSpans": [ { "uuid": "<RETRIEVER-SPAN-UUID>", "name": "retrieve_context", "embedder": "text-embedding-3-small", "input": "capital of France", "retrievalContext": [ "Paris is the capital and most populous city of France." ], "startTime": "2025-01-15T10:30:00Z", "endTime": "2025-01-15T10:30:01Z", "metricCollection": "Retriever Collection Name" } ], "llmSpans": [ { "uuid": "<LLM-SPAN-UUID>", "parentUuid": "<RETRIEVER-SPAN-UUID>", "name": "generate_answer", "model": "gpt-4o", "input": "Answer using the retrieved context.", "output": "The capital of France is Paris.", "startTime": "2025-01-15T10:30:01Z", "endTime": "2025-01-15T10:30:05Z", "metricCollection": "LLM Collection Name" } ] }'Here the trace still gets its end-to-end score from its own
metricCollection, while each span is evaluated by the collection you attach to it — one for the retriever, another for the model. Set each span'stype—retriever,llm,tool, oragent— so it's evaluated by the right kind of metric.Read the results
Confident AI automatically closes the run out on its own, tallies the pass and fail counts, and marks it complete — see When a run finishes for more details.
Open the
linkfrom step 1 to read the run on the platform — every test case, its trace, and its scores at both levels. To pull the results into your own pipeline instead, fetch the run:GET/v1/test-runs/{testRunId} curl -X GET "https://api.confident-ai.com/v1/test-runs/{testRunId}" \ -H "CONFIDENT_API_KEY: <PROJECT-API-KEY>"Done ✅. The response gives you the run's overall
metricsScoresand atestCasesarray to analyze them on your own.
Send Traces over OpenTelemetry
If your app already emits OpenTelemetry spans, you can easily carry the same fields as span attributes and export the spans to Confident AI's OTel endpoint.
The moves are identical to the walkthrough above. You still open the run over the API to get a testRunId; from there, everything rides on the spans you already emit. Point your OTLP/HTTP exporter at Confident AI's OpenTelemetry endpoint, authenticated with the x-confident-api-key header:
https://otel.confident-ai.com/v1/tracesThen set two groups of attributes:
- On the root span — the test case itself:
confident.trace.test_run_id,confident.trace.metric_collection,confident.trace.input,confident.trace.output, andconfident.trace.name. - On each child span — a component:
confident.span.type,confident.span.name,confident.span.input,confident.span.output, andconfident.span.metric_collection.
Attribute values are strings, so JSON-encode anything structured — a list of retrieved chunks, for instance.
OpenTelemetry is language agnostic, so you can always send the traces from your app natively and still get the same test runs as the API or regular SDK users. Here are a few examples in different languages:
The root span carries the confident.trace.* attributes that make it a test case; the child span carries confident.span.* to evaluate a component.
use opentelemetry::{global, trace::{Tracer, TraceContextExt}, KeyValue};
use opentelemetry_otlp::WithExportConfig;
use opentelemetry_sdk::runtime;
use std::collections::HashMap;

fn init_tracer() {
    let mut headers = HashMap::new();
    headers.insert(
        "x-confident-api-key".to_string(),
        std::env::var("CONFIDENT_API_KEY").expect("CONFIDENT_API_KEY not set"),
    );

    opentelemetry_otlp::new_pipeline()
        .tracing()
        .with_exporter(
            opentelemetry_otlp::new_exporter()
                .http()
                .with_endpoint("https://otel.confident-ai.com/v1/traces")
                .with_headers(headers),
        )
        .install_batch(runtime::Tokio)
        .expect("failed to install tracer");
}

#[tokio::main]
async fn main() {
    init_tracer();
    let tracer = global::tracer("confident-test-run");
    let test_run_id = "your-test-run-id"; // the id from step 1

    let input = "Can I get a refund on my annual plan after two months?";
    let output = "Annual plans are refundable on a prorated basis within the first 30 days...";

    // Root span → the test case, evaluated end to end.
    tracer.in_span("Refund policy question", |cx| {
        let root = cx.span();
        root.set_attribute(KeyValue::new("confident.trace.test_run_id", test_run_id));
        root.set_attribute(KeyValue::new("confident.trace.metric_collection", "Agent Quality"));
        root.set_attribute(KeyValue::new("confident.trace.name", "Refund policy question"));
        root.set_attribute(KeyValue::new("confident.trace.input", input));
        root.set_attribute(KeyValue::new("confident.trace.output", output));

        // Child span → a component, evaluated on its own.
        tracer.in_span("generate_answer", |cx| {
            let span = cx.span();
            span.set_attribute(KeyValue::new("confident.span.type", "llm"));
            span.set_attribute(KeyValue::new("confident.span.name", "generate_answer"));
            span.set_attribute(KeyValue::new("confident.span.input", "Answer using the policy context..."));
            span.set_attribute(KeyValue::new("confident.span.output", output));
            span.set_attribute(KeyValue::new("confident.span.metric_collection", "Answer Quality"));
        });
    });

    global::shutdown_tracer_provider(); // flush before the process exits
}
Using the OpenTelemetry Java SDK through interop. The exporter points at Confident AI with the x-confident-api-key header; the root and child spans carry the same attributes.
(ns traces
  (:import
   [io.opentelemetry.api.common Attributes]
   [io.opentelemetry.exporter.otlp.http.trace OtlpHttpSpanExporter]
   [io.opentelemetry.sdk OpenTelemetrySdk]
   [io.opentelemetry.sdk.trace SdkTracerProvider]
   [io.opentelemetry.sdk.trace.export BatchSpanProcessor]
   [java.util.concurrent TimeUnit]))

(defn build-sdk []
  (let [exporter (-> (OtlpHttpSpanExporter/builder)
                     (.setEndpoint "https://otel.confident-ai.com/v1/traces")
                     (.addHeader "x-confident-api-key" (System/getenv "CONFIDENT_API_KEY"))
                     (.build))
        provider (-> (SdkTracerProvider/builder)
                     (.addSpanProcessor (-> (BatchSpanProcessor/builder exporter) (.build)))
                     (.build))]
    (-> (OpenTelemetrySdk/builder)
        (.setTracerProvider provider)
        (.build))))

(defn -main []
  (let [sdk         (build-sdk)
        tracer      (.getTracer sdk "confident-test-run")
        test-run-id "your-test-run-id" ; the id from step 1
        input       "Can I get a refund on my annual plan after two months?"
        output      "Annual plans are refundable on a prorated basis within the first 30 days..."
        ;; Root span → the test case, evaluated end to end.
        root (-> (.spanBuilder tracer "Refund policy question")
                 (.setAllAttributes
                  (-> (Attributes/builder)
                      (.put "confident.trace.test_run_id" test-run-id)
                      (.put "confident.trace.metric_collection" "Agent Quality")
                      (.put "confident.trace.name" "Refund policy question")
                      (.put "confident.trace.input" input)
                      (.put "confident.trace.output" output)
                      (.build)))
                 (.startSpan))]
    (with-open [_ (.makeCurrent root)]
      ;; Child span → a component, evaluated on its own.
      (let [child (-> (.spanBuilder tracer "generate_answer")
                      (.setAllAttributes
                       (-> (Attributes/builder)
                           (.put "confident.span.type" "llm")
                           (.put "confident.span.name" "generate_answer")
                           (.put "confident.span.input" "Answer using the policy context...")
                           (.put "confident.span.output" output)
                           (.put "confident.span.metric_collection" "Answer Quality")
                           (.build)))
                      (.startSpan))]
        (.end child)))
    (.end root)
    ;; Flush before the process exits.
(.. sdk getSdkTracerProvider (shutdown) (join 10 TimeUnit/SECONDS))))Once the spans land, they join the same run and finalize just like the cases you sent over the API. Read the results the same way.
Field & Attribute Reference
The API body and the OpenTelemetry attributes carry the same test case — one names its fields in JSON, the other on spans. Use this to move between them:
| What it is | API field | OpenTelemetry attribute |
|---|---|---|
| The run to file the case under | testRunId | confident.trace.test_run_id |
| Metrics that evaluate the test case (unless the run sets a default) | metricCollection | confident.trace.metric_collection |
| What the app was asked | input | confident.trace.input |
| What the app answered | output | confident.trace.output |
| A name for the case | name | confident.trace.name |
| A component's kind | spans[].type | confident.span.type |
| A component's name | spans[].name | confident.span.name |
| A component's input | spans[].input | confident.span.input |
| A component's output | spans[].output | confident.span.output |
| Metrics that evaluate a component | spans[].metricCollection | confident.span.metric_collection |
Concepts
The walkthrough is enough to run a benchmark. This section covers what's happening underneath — how a trace turns into a test case, and how a run knows when it's done.
How a trace becomes a test case
A trace, on its own, is a record of something your app did in production. Two things promote it to a test case: a testRunId pointing at an open run, and a metricCollection to evaluate it with.
sequenceDiagram
    participant App as Your app
    participant CA as Confident AI
    participant Run as Test run

    App->>CA: Open a run
    CA-->>App: Run id
    loop One per test case
        App->>CA: Trace + run id + metrics
        CA->>Run: File as a test case
        CA->>CA: Evaluate against the metrics
    end
    Note over Run: Closes on its own once<br/>every case is scored
With both present, Confident AI derives a test case from the trace's input and output, evaluates it with the collection you named, and files the result under the run. Everything else about the trace — its spans, its timings, its metadata — is kept intact, so opening a test case shows you the exact trace behind its score.
Evaluating the whole vs. the parts
The two levels answer different questions, and they run together on the same case:
- The whole — the
metricCollectionon the trace — asks: given this input, was the final answer good? - The parts — a
metricCollectionon a span — asks: did this one step do its job? Was the retrieved context relevant, did the tool get the right arguments, did the model stay on policy?
Trace-level scores tell you whether a case failed. Component-level scores tell you where. Together they turn a red test case into a diagnosis.
When a run finishes
There's no "done" call. A run stays open and keeps accepting test cases for as long as they keep arriving — which is what lets you stream cases in over the life of a test suite.
Confident AI closes the run automatically once it has been idle for 4 hours — four hours with no new or updated test case. At that point it computes the run's pass and fail totals and marks it complete — which means it no longer accepts new test cases. Each case you send resets the idle clock, so an active run never closes mid-suite; when your suite stops, the run settles on its own about four hours after the last case lands.
Best Practices
A few habits keep trace-based runs trustworthy as your app and test suite grow:
- Keep one metric collection per level, and reuse it. Evaluate every test case in a run with the same trace-level collection so scores are comparable, and reserve dedicated collections for the components you care about.
- Own your trace
uuids. Generate them yourself so you can tie a test case back to your own logs and re-send it deterministically when you need to. - JSON-encode structured OpenTelemetry values. Attributes are strings — encode lists and objects (like a span's retrieved context) as JSON so they come through intact.
- Always flush before exit. Batch exporters drop spans when a process dies first. Shut the tracer down at the end of a test script so every case is sent.
- Keep benchmarks out of production data. Run pre-deployment benchmarks in a dedicated project or environment so test cases don't blur into your production observability.
FAQ
My traces are showing up as normal traces, not test cases.
A trace becomes a test case only when it carries a testRunId pointing at an
open run in your project, plus a metric collection to evaluate it — set on the
trace or inherited from the run. If the testRunId is wrong, points at a run
that's already closed, or belongs to another project, the trace is kept as
ordinary telemetry instead.
Do I have to send traces over the API and OpenTelemetry both?
No — pick whichever your app already uses. Both produce the same test cases in the same run, so you can even mix them: send some cases over the API and others over OpenTelemetry into the same test run.
Can I benchmark conversations this way?
Not yet — trace-based runs are single-turn, one input and output per case. For multi-turn, conversational evaluations, see metric collections and the multi-turn evaluation options.
How do I know when the run is finished?
Fetch GET /v1/test-runs/{id} and check its status, or watch it on the
platform. It flips to complete on its own once the run has been idle for 4
hours — four hours with no new or updated test case. See When a run
finishes.
Next Steps
You can now benchmark quality before every release, built entirely from your app's traces. To go further:
Metric Collections
Define what "good" means — the collections that evaluate your test cases end to end and step by step.
OpenTelemetry
See how Confident AI ingests spans and which confident.* attributes it reads.
Trace Broadcasting
Send OpenTelemetry traces to Confident AI from Go, Java, Ruby, C#, and more.
LLM Evaluation
Compare runs over time, gate releases on them, and track quality as your app evolves.
Last updated on