Compare Models in Production
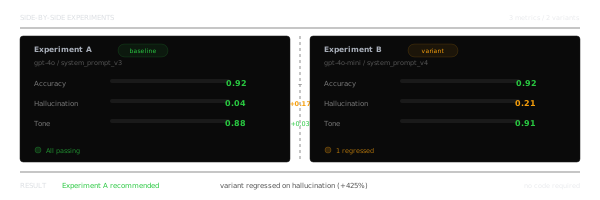
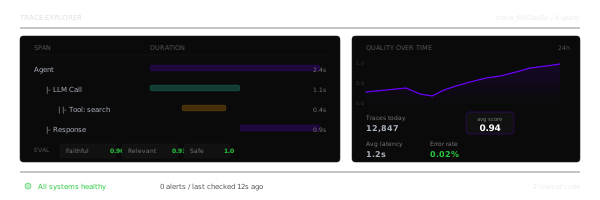
Attach different models to the same agent, score every model with the same metrics, and compare them on a dashboard.
Overview
You can compare one deployed agent across multiple models by logging the model choice as trace metadata. Confident AI can then run the same online metrics for every trace and build dashboards that filter, split, and trend results by that metadata.
This guide shows the pattern with confident-trace across OpenAI Agents, LangGraph, Vercel AI SDK, and Strands Agents. The core idea is always the same: every request emits a trace, every trace includes a stable model_variant, and every model variant is scored by the same metric collection.
graph LR
    User["User request"] --> Agent["Same agent"]
    Agent -->|model_variant| M1["Model A"]
    Agent -->|model_variant| M2["Model B"]
    Agent -->|model_variant| M3["Model C"]
    M1 --> Trace["Trace<br/>metadata.model_variant"]
    M2 --> Trace
    M3 --> Trace
    Trace --> Evals["Online evals<br/>same metric collection"]
    Evals --> Dashboard["Dashboard split by model_variant<br/>quality · volume · latency"]

    style Agent fill:#eef2ff,stroke:#6366f1
    style Trace fill:#eef2ff,stroke:#6366f1
    style Dashboard fill:#eef2ff,stroke:#6366f1
Here's the thing: the model name captured on an LLM span is useful for debugging, but it is often too provider-specific to analyze — and it lives on the span, not the trace. Promoting a stable model_variant to the trace gives every dashboard one clean, product-level dimension to break down, filter, and trend by, even if the underlying provider model ID changes.
This same pattern compares far more than models. Anything you can label on a trace — prompt versions, temperature, retrievers, tool sets — can be compared the exact same way. See Compare Any Parameter to repeat this guide for a different variable.
What You'll Build
By the end, you will have:
- A traced agent that records
model_variantandmodel_idon every trace. - A repeatable command to generate comparison traffic for each model variant.
- A metric collection that scores every variant with the same criteria.
- A dashboard that compares quality, trace volume, and latency across variants.
- A clear read of which model wins, not just on one lucky slice of traffic.
Prerequisites
You need a Confident AI project, a project API key, and credentials for whichever model provider your agent calls. For OpenAI-based examples, set OPENAI_API_KEY. For the Strands example, configure AWS credentials with access to the Bedrock model IDs you use.
Install confident-trace alongside the framework you are using:
The openai-agents extra installs the tracing bridge for the framework, not the framework itself, so install openai-agents alongside it.
python -m venv .venv
source .venv/bin/activate
pip install -U 'confident-trace[openai-agents]' openai-agentspython -m venv .venv
source .venv/bin/activate
pip install -U confident-trace 'langgraph>=1,<2' 'langchain-openai>=1,<2'Requires Node.js 22+ and AI SDK 7.
npm install confident-trace 'ai@>=7.0.93 <8' @ai-sdk/openai@4
npm install -D tsx
Strands emits its own OpenTelemetry spans, and confident-trace exports them — no extra exporter packages are needed.
python -m venv .venv
source .venv/bin/activate
pip install -U confident-trace strands-agents
Then configure your project and provider credentials for that same integration:
export CONFIDENT_API_KEY="confident_us..."
export OPENAI_API_KEY="sk-..."export CONFIDENT_API_KEY="confident_us..."
export OPENAI_API_KEY="sk-..."export CONFIDENT_API_KEY="confident_us..."
export OPENAI_API_KEY="sk-..."export CONFIDENT_API_KEY="confident_us..."
export AWS_REGION="us-east-1"
export AWS_PROFILE="your-aws-profile"For EU projects, point OpenTelemetry export to the EU endpoint:
export CONFIDENT_OTEL_ENDPOINT="https://eu.otel.confident-ai.com/v1/traces"Set Up Tracing
Tracing is what feeds every dashboard in this guide. In three steps, you'll instrument the agent so each request emits a trace tagged with model_variant, attach the metric collection that scores every variant, and verify the data shape before building any widgets.
Instrument the Agent
The most important implementation detail is where you attach metadata. Add model_variant to the trace, not just the LLM span, because dashboards commonly aggregate at the trace level: average trace score, trace count, trace latency, and trace-level online eval results.
With confident-trace, the pattern is the same for every framework: call init() once at startup (it detects the installed framework and instruments it), wrap your agent invocation in an application span so the request has a clear entry point, and call update_trace / updateTrace inside it to set the trace input, output, and comparison metadata.
Create the traced agent
Create a small agent module that accepts a normalized model variant, resolves it to the provider model ID, runs the agent, and records both names on the current trace.
Each integration below emits the same dashboard keys:
model_variant,model_id,agent,agent_version, androllout. The deployment environment is set once oninit()instead, since it's a first-class trace field.init()enables the OpenAI Agents bridge automatically, so the agent, model, and tool spans nest under yoursupport-agentspan with no trace processor to register.openai_agents_model_compare.py import os import sys from agents import Agent, Runner from confident_trace import init, span, update_trace, shutdown MODEL_MAP = {"gpt-4o-mini": "gpt-4o-mini", "gpt-4o": "gpt-4o", "gpt-4.1": "gpt-4.1"} init(environment=os.getenv("APP_ENV", "production")) def run_agent(user_input: str, model_variant: str) -> str: model_id = MODEL_MAP[model_variant] agent = Agent( name="Support Agent", instructions="Answer support questions clearly and safely.", model=model_id, ) with span("support-agent", type="agent"): output = Runner.run_sync(agent, user_input).final_output update_trace( metric_collection="Agent Quality", input=user_input, output=output, metadata={ "agent": "support-agent", "agent_version": os.getenv("AGENT_VERSION", "v2"), "model_variant": model_variant, "model_id": model_id, "rollout": os.getenv("ROLLOUT_NAME", "model-comparison"), }, ) return output if __name__ == "__main__": try: print(run_agent(sys.argv[2], sys.argv[1])) finally: shutdown()init()detects LangGraph and instruments the graph run — no callback handler is required. Wrap the invocation in aspanso the metadata lands on the trace, not on a node.langgraph_model_compare.py import os import sys from langchain_openai import ChatOpenAI from langgraph.graph import END, START, MessagesState, StateGraph from confident_trace import init, span, update_trace, shutdown MODEL_MAP = {"gpt-4o-mini": "gpt-4o-mini", "gpt-4o": "gpt-4o", "gpt-4.1": "gpt-4.1"} init(environment=os.getenv("APP_ENV", "production")) def run_agent(user_input: str, model_variant: str) -> str: model_id = MODEL_MAP[model_variant] model = ChatOpenAI(model=model_id) def assistant(state: MessagesState): return {"messages": [model.invoke(state["messages"])]} graph = ( StateGraph(MessagesState) .add_node("assistant", assistant) .add_edge(START, "assistant") .add_edge("assistant", END) .compile() ) with span("support-agent", type="agent"): result = graph.invoke({"messages": [{"role": "user", "content": user_input}]}) output = result["messages"][-1].content update_trace( metric_collection="Agent Quality", input=user_input, output=output, metadata={ "agent": "support-agent", "agent_version": os.getenv("AGENT_VERSION", "v2"), "model_variant": model_variant, "model_id": model_id, "rollout": os.getenv("ROLLOUT_NAME", "model-comparison"), }, ) return output if __name__ == "__main__": try: print(run_agent(sys.argv[2], sys.argv[1])) finally: shutdown()For the Vercel AI SDK,
init()plus theconfident-trace/registerpreload instrumentsgenerateTextautomatically — notelemetryoption or tracer is needed. Wrap each generation inwithSpanand set the comparison metadata withupdateTrace.vercel-ai-model-compare.ts import { generateText } from "ai"; import { openai } from "@ai-sdk/openai"; import { init, withSpan, updateTrace } from "confident-trace"; const runtime = init({ environment: process.env.APP_ENV ?? "production" }); const modelMap: Record<string, string> = { "gpt-4o-mini": "gpt-4o-mini", "gpt-4o": "gpt-4o", "gpt-4.1": "gpt-4.1", }; export async function runAgent(input: string, modelVariant: string) { const modelId = modelMap[modelVariant]; return withSpan({ name: "support-agent", type: "agent" }, async () => { updateTrace({ metricCollection: "Agent Quality", input, metadata: { agent: "support-agent", agent_version: process.env.AGENT_VERSION ?? "v2", model_variant: modelVariant, model_id: modelId, rollout: process.env.ROLLOUT_NAME ?? "model-comparison", }, }); const { text } = await generateText({ model: openai(modelId), prompt: input, }); updateTrace({ output: text }); return text; }); } const [variant, ...rest] = process.argv.slice(2); try { console.log(await runAgent(rest.join(" "), variant)); } finally { await runtime.shutdown(); }Strands captures the agent, model, and tool spans itself;
init()exports them to Confident AI. Wrap the run in aspanand useupdate_traceto add the normalized comparison metadata to the trace.strands_model_compare.py import os import sys from confident_trace import init, span, update_trace, shutdown from strands import Agent MODEL_MAP = { "nova-lite": "us.amazon.nova-lite-v1:0", "nova-pro": "us.amazon.nova-pro-v1:0", "claude-sonnet": "us.anthropic.claude-3-5-sonnet-20241022-v2:0", } init(environment=os.getenv("APP_ENV", "production")) def run_agent(user_input: str, model_variant: str) -> str: model_id = MODEL_MAP[model_variant] with span("support-agent", type="agent"): output = str(Agent(model=model_id, callback_handler=None)(user_input)) update_trace( metric_collection="Agent Quality", input=user_input, output=output, metadata={ "agent": "support-agent", "agent_version": os.getenv("AGENT_VERSION", "v2"), "model_variant": model_variant, "model_id": model_id, "rollout": os.getenv("ROLLOUT_NAME", "model-comparison"), }, ) return output if __name__ == "__main__": try: print(run_agent(sys.argv[2], sys.argv[1])) finally: shutdown()Metadata keys can be any string you want —
model_variantandmodel_idare just the ones we use for this example. Here,model_variantis the short, human-readable label you compare on, andmodel_idis the exact provider value kept for auditability, even if it is noisy. Name your keys whatever is most useful for you.Run a local trace
Send one request per variant to confirm traces reach Confident AI with the right metadata. Each script takes the variant and the input as positional arguments.
Run OpenAI Agents traces export AGENT_VERSION="v2" export ROLLOUT_NAME="model-comparison-smoke-test" export APP_ENV="production" for model in gpt-4o-mini gpt-4o gpt-4.1; do python openai_agents_model_compare.py "$model" \ "A customer says their invoice doubled after upgrading. Explain what to check first." doneRun LangGraph traces export AGENT_VERSION="v2" export ROLLOUT_NAME="model-comparison-smoke-test" export APP_ENV="production" for model in gpt-4o-mini gpt-4o gpt-4.1; do python langgraph_model_compare.py "$model" \ "A customer says their invoice doubled after upgrading. Explain what to check first." doneTypeScript needs the
confident-trace/registerpreload so the SDK can hook the AI SDK as Node loads it:Run Vercel AI SDK traces export AGENT_VERSION="v2" export ROLLOUT_NAME="model-comparison-smoke-test" export APP_ENV="production" for model in gpt-4o-mini gpt-4o gpt-4.1; do node --import tsx --import confident-trace/register vercel-ai-model-compare.ts "$model" \ "A customer says their invoice doubled after upgrading. Explain what to check first." doneRun Strands traces export AGENT_VERSION="v2" export ROLLOUT_NAME="model-comparison-smoke-test" export APP_ENV="production" for model in nova-lite nova-pro claude-sonnet; do python strands_model_compare.py "$model" \ "A customer says their invoice doubled after upgrading. Explain what to check first." doneTraces appear in the Observatory as soon as the agent runs Done ✅. You now have at least one trace per model variant.
Create Metrics
Use the same metric collection for every model variant so each is scored against identical criteria. Your project's evaluation model — the LLM judge — is shared across every collection, so the judge itself is already consistent. The trap is scoring gpt-4o-mini and gpt-4o with different collections: you would be trending scores from two different rubrics, so the dashboard is no longer an apples-to-apples comparison.
Create a metric collection
Open Project > Metrics > Collections, create a collection named
Agent Quality, and add trace-level metrics that match the agent's job.Create the metric collection that every model variant will use For a support agent, a strong starting collection is:
- Task Completion for whether the answer solved the user's request.
- Answer Relevancy for whether the response stayed focused.
- A custom G-Eval metric for your product-specific standard, such as "support policy compliance" or "escalation quality".
Attach the collection
Each instrumentation example passes
metric_collection="Agent Quality"ormetricCollection: "Agent Quality"toupdate_trace/updateTrace. This directly schedules the same collection for every model variant.Alternatively, remove
metric_collection/metricCollectionfrom the code and create a trace-level Evaluation Rule in Workflows > Traces that:- Matches your comparison traffic with a filter such as
metadata.rollout = model-comparison(ormetadata.agent = support-agent). - Runs the
Agent Qualitymetric collection on every matching trace.
An explicit collection set by the SDK takes precedence over matching UI rules. See online evals for both approaches.
- Matches your comparison traffic with a filter such as
Generate enough scored traces
Dashboards are only useful once there is enough data to compare. Run each variant across a few prompts so the metric collection scores a batch of traces.
Generate comparison traffic prompts=( "A customer cannot access invoices after changing teams. Help them troubleshoot." "Summarize why a trial user should upgrade, but do not mention unavailable features." "The integration failed with an OAuth callback error. Explain the likely cause." "A user asks for a refund after annual renewal. Give a careful support response." ) for model in gpt-4o-mini gpt-4o gpt-4.1; do for prompt in "${prompts[@]}"; do python openai_agents_model_compare.py "$model" "$prompt" done doneGenerate comparison traffic prompts=( "A customer cannot access invoices after changing teams. Help them troubleshoot." "Summarize why a trial user should upgrade, but do not mention unavailable features." "The integration failed with an OAuth callback error. Explain the likely cause." "A user asks for a refund after annual renewal. Give a careful support response." ) for model in gpt-4o-mini gpt-4o gpt-4.1; do for prompt in "${prompts[@]}"; do python langgraph_model_compare.py "$model" "$prompt" done doneGenerate comparison traffic prompts=( "A customer cannot access invoices after changing teams. Help them troubleshoot." "Summarize why a trial user should upgrade, but do not mention unavailable features." "The integration failed with an OAuth callback error. Explain the likely cause." "A user asks for a refund after annual renewal. Give a careful support response." ) for model in gpt-4o-mini gpt-4o gpt-4.1; do for prompt in "${prompts[@]}"; do node --import tsx --import confident-trace/register vercel-ai-model-compare.ts "$model" "$prompt" done doneGenerate comparison traffic prompts=( "A customer cannot access invoices after changing teams. Help them troubleshoot." "Summarize why a trial user should upgrade, but do not mention unavailable features." "The integration failed with an OAuth callback error. Explain the likely cause." "A user asks for a refund after annual renewal. Give a careful support response." ) for model in nova-lite nova-pro claude-sonnet; do for prompt in "${prompts[@]}"; do python strands_model_compare.py "$model" "$prompt" done done
Verify the Traces
Before building dashboards, verify that the data shape is right. It is much easier to fix metadata and metric-collection names before you create five widgets around them.
Open the Observatory
In Confident AI, go to Observatory and filter for your agent or rollout:
metadata.agent = support-agentmetadata.rollout = model-comparisonmetadata.model_variant = gpt-4ofor OpenAI-based examples, ormetadata.model_variant = nova-profor Strands
Inspect one trace
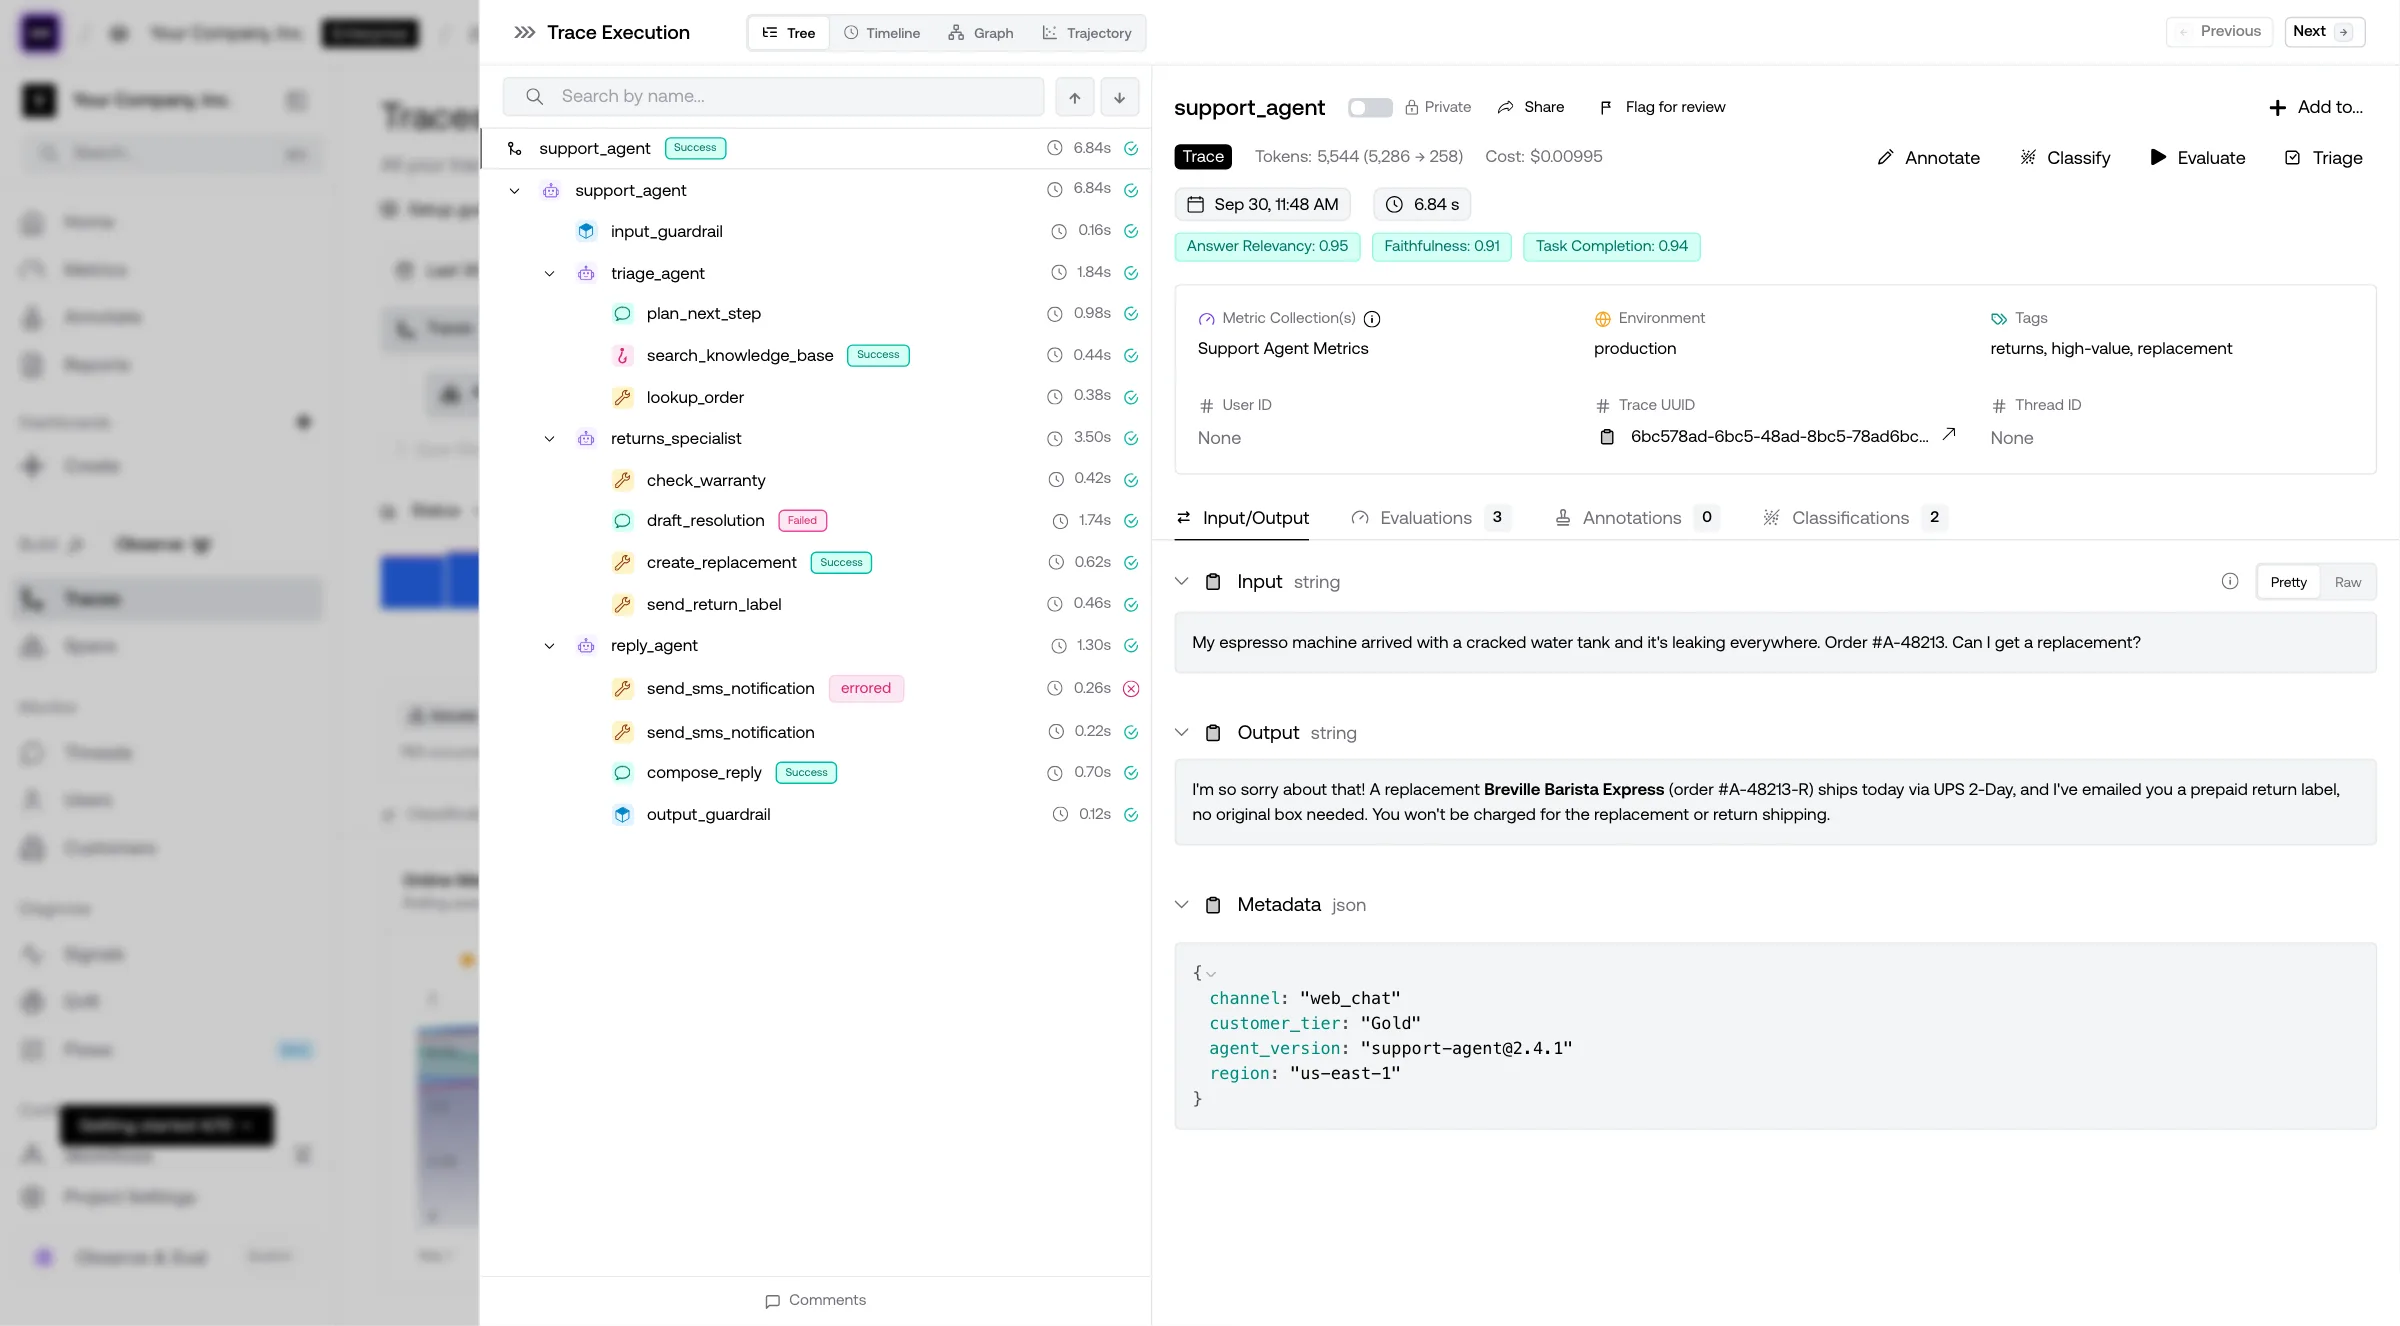
Open a trace and confirm four things:
- The trace input and output are populated.
- The trace metadata includes
model_variant,model_id,agent_version, androllout. - The LLM span captured the provider model details from your integration.
- The trace has online eval results from
Agent Quality, or shows a clear metric error you can fix.
Online eval scores appear on the trace after ingestion
Create the Dashboard
The traces and scores from the previous step feed the dashboard. Build it either way — pick Platform to click through the Confident AI UI, or CLI to run a reproducible script against the Dashboards API. Your choice sticks across every step below, so you only pick once.
Create the dashboard
In Confident AI, create the dashboard from the sidebar:
- Open Dashboards.
- Click New Dashboard.
- Set Name to
Model Variant Comparison. - Set Description to
Compares support-agent quality, volume, and latency by metadata.model_variant. - Keep Private off to share it with the project, or on for a personal draft.
- Click Create.
Set your credentials, then create an empty dashboard and capture its ID for the next steps:
Create the dashboard export CONFIDENT_API_KEY="confident_us..." export CONFIDENT_API_BASE="https://api.confident-ai.com" export DASHBOARD_ID="$( curl -sS -X POST "$CONFIDENT_API_BASE/v1/dashboards" \ -H "CONFIDENT_API_KEY: $CONFIDENT_API_KEY" \ -H "Content-Type: application/json" \ -d '{ "name": "Model Variant Comparison", "description": "Compares support-agent quality, volume, and latency by metadata.model_variant.", "private": false }' \ | python -c 'import json,sys; print(json.load(sys.stdin)["data"]["id"])' )" echo "Created dashboard: $DASHBOARD_ID"Create a dashboard Add quality by model
Click Add widget and create a time-series widget that breaks down quality by
model_variant:Setting Value Widget name Average quality by modelShape Time series Display Line Mode Breakdown Data model Metric Data Belongs to Trace Metric collection Agent QualityAggregation Average score Filter metadata.agent = support-agentDimension Metadata Metadata key model_variantTop K Top 10 This is the main comparison chart: which model scores higher over time under the same metric collection?
Add one line per variant. Each line filters to
support-agentand onemodel_variant:Add the quality widget curl -sS -X POST "$CONFIDENT_API_BASE/v1/dashboards/$DASHBOARD_ID/widgets" \ -H "CONFIDENT_API_KEY: $CONFIDENT_API_KEY" \ -H "Content-Type: application/json" \ -d '{ "name": "Average quality by model", "type": "LINE", "unit": "SCORE", "mode": "TIME_SERIES", "lines": [ { "name": "gpt-4o-mini", "color": "BLUE", "dataModel": "METRIC_DATA", "aggregation": "AVG_SCORE", "extraQueryParams": { "category": "TRACE", "metricName": "Task Completion" }, "filters": { "operator": "AND", "groups": [ { "operator": "AND", "filters": [ { "category": "Metadata", "condition": "Is", "key": "agent", "value": "support-agent" }, { "category": "Metadata", "condition": "Is", "key": "model_variant", "value": "gpt-4o-mini" } ] } ] } }, { "name": "gpt-4o", "color": "EMERALD", "dataModel": "METRIC_DATA", "aggregation": "AVG_SCORE", "extraQueryParams": { "category": "TRACE", "metricName": "Task Completion" }, "filters": { "operator": "AND", "groups": [ { "operator": "AND", "filters": [ { "category": "Metadata", "condition": "Is", "key": "agent", "value": "support-agent" }, { "category": "Metadata", "condition": "Is", "key": "model_variant", "value": "gpt-4o" } ] } ] } }, { "name": "gpt-4.1", "color": "VIOLET", "dataModel": "METRIC_DATA", "aggregation": "AVG_SCORE", "extraQueryParams": { "category": "TRACE", "metricName": "Task Completion" }, "filters": { "operator": "AND", "groups": [ { "operator": "AND", "filters": [ { "category": "Metadata", "condition": "Is", "key": "agent", "value": "support-agent" }, { "category": "Metadata", "condition": "Is", "key": "model_variant", "value": "gpt-4.1" } ] } ] } } ] }'Add trace volume
Add a second time-series widget for traffic volume, so you don't over-trust a model that only handled a few easy requests:
Setting Value Widget name Trace volume by modelShape Time series Display Stacked bar Mode Breakdown Data model Trace Aggregation Count Filter metadata.agent = support-agentDimension Metadata Metadata key model_variantTop K Top 10 Add the volume widget curl -sS -X POST "$CONFIDENT_API_BASE/v1/dashboards/$DASHBOARD_ID/widgets" \ -H "CONFIDENT_API_KEY: $CONFIDENT_API_KEY" \ -H "Content-Type: application/json" \ -d '{ "name": "Trace volume by model", "type": "STACKED_BAR", "unit": "COUNT", "mode": "TIME_SERIES", "lines": [ { "name": "gpt-4o-mini", "color": "BLUE", "dataModel": "TRACE", "aggregation": "COUNT", "filters": { "operator": "AND", "groups": [ { "operator": "AND", "filters": [ { "category": "Metadata", "condition": "Is", "key": "agent", "value": "support-agent" }, { "category": "Metadata", "condition": "Is", "key": "model_variant", "value": "gpt-4o-mini" } ] } ] } }, { "name": "gpt-4o", "color": "EMERALD", "dataModel": "TRACE", "aggregation": "COUNT", "filters": { "operator": "AND", "groups": [ { "operator": "AND", "filters": [ { "category": "Metadata", "condition": "Is", "key": "agent", "value": "support-agent" }, { "category": "Metadata", "condition": "Is", "key": "model_variant", "value": "gpt-4o" } ] } ] } }, { "name": "gpt-4.1", "color": "VIOLET", "dataModel": "TRACE", "aggregation": "COUNT", "filters": { "operator": "AND", "groups": [ { "operator": "AND", "filters": [ { "category": "Metadata", "condition": "Is", "key": "agent", "value": "support-agent" }, { "category": "Metadata", "condition": "Is", "key": "model_variant", "value": "gpt-4.1" } ] } ] } } ] }'Add P90 latency
Add a latency widget so the quality winner isn't judged on quality alone:
Setting Value Widget name P90 latency by modelShape Time series Display Line Mode Breakdown Data model Trace Aggregation P90 latency Filter metadata.agent = support-agentDimension Metadata Metadata key model_variantTop K Top 10 For model-call latency instead of whole-trace latency, switch the data model to Span, choose the LLM span type, and keep the same
model_variantbreakdown.Add the latency widget curl -sS -X POST "$CONFIDENT_API_BASE/v1/dashboards/$DASHBOARD_ID/widgets" \ -H "CONFIDENT_API_KEY: $CONFIDENT_API_KEY" \ -H "Content-Type: application/json" \ -d '{ "name": "P90 latency by model", "type": "LINE", "unit": "MILLISECONDS", "mode": "TIME_SERIES", "lines": [ { "name": "gpt-4o-mini", "color": "BLUE", "dataModel": "TRACE", "aggregation": "P90_LATENCY", "filters": { "operator": "AND", "groups": [ { "operator": "AND", "filters": [ { "category": "Metadata", "condition": "Is", "key": "agent", "value": "support-agent" }, { "category": "Metadata", "condition": "Is", "key": "model_variant", "value": "gpt-4o-mini" } ] } ] } }, { "name": "gpt-4o", "color": "EMERALD", "dataModel": "TRACE", "aggregation": "P90_LATENCY", "filters": { "operator": "AND", "groups": [ { "operator": "AND", "filters": [ { "category": "Metadata", "condition": "Is", "key": "agent", "value": "support-agent" }, { "category": "Metadata", "condition": "Is", "key": "model_variant", "value": "gpt-4o" } ] } ] } }, { "name": "gpt-4.1", "color": "VIOLET", "dataModel": "TRACE", "aggregation": "P90_LATENCY", "filters": { "operator": "AND", "groups": [ { "operator": "AND", "filters": [ { "category": "Metadata", "condition": "Is", "key": "agent", "value": "support-agent" }, { "category": "Metadata", "condition": "Is", "key": "model_variant", "value": "gpt-4.1" } ] } ] } } ] }'Verify the dashboard
Set the shared dashboard date range to Last 7 days or Last 30 days, then confirm all three widgets break down by
model_variant.Done ✅. You now have a dashboard that compares quality, volume, and latency by model.
Fetch the dashboard to confirm all three widgets were saved:
Fetch the dashboard curl -sS "$CONFIDENT_API_BASE/v1/dashboards/$DASHBOARD_ID" \ -H "CONFIDENT_API_KEY: $CONFIDENT_API_KEY"Done ✅. You now have a dashboard that compares quality, volume, and latency by model.
Preview of the dashboard
Interpret Results
A model that scores higher is only the better choice if it also handled enough traffic to trust and kept latency acceptable. Read the three widgets together:
- Quality: Is the candidate's average score higher over a meaningful date range?
- Volume: Does each variant have enough traces to trust the result? Low-volume variants can win by chance.
- Latency: Is P90 latency still acceptable for your product?
Compare Any Parameter
Here's the key insight: nothing in this guide is actually model-specific. model_variant is just the metadata key every dashboard breaks down by. Swap it for any variable you want to A/B and the exact same workflow — one agent, one metric collection, three widgets — still applies. You're not comparing models, you're comparing whatever you label on the trace.
To compare something else, repeat the guide and change only two things:
- The metadata key you attach on the trace. Log
prompt_version(ortemperature,retriever, ...) instead of, or alongside,model_variant. - The dimension each widget breaks down by. Point the same dashboard filters at the new key.
Everything else stays identical. The new key is attached exactly like model_variant — as trace metadata:
update_trace(
    metric_collection="Agent Quality",
    input=user_input,
    output=output,
    metadata={
        "agent": "support-agent",
        "prompt_version": prompt_variant,  # the dimension you're now comparing
    },
)
Common parameters teams compare this way:
- Prompt versions —
prompt_version: v3vsv4. - Decoding settings —
temperature: 0.2vs0.7. - Retrieval strategy —
retriever: bm25vshybrid, orchunk_size: 512vs1024. - Tool sets —
toolset: minimalvsfull. - Agent versions —
agent_version: v2vsv3.
Chart Any Measure
And just like the breakdown dimension is swappable, so is the measure each widget plots. This guide charts quality (AVG_SCORE), trace volume (COUNT), and P90 latency (P90_LATENCY) — but that's only three of many. Add a line with a different aggregation and you have a new comparison from the exact same traffic.
Measures you can break down by any dimension:
- Quality —
AVG_SCORE,PASS_RATE,FAILURE_RATE, orAVG_RATINGfor any metric in your collection. - Latency —
AVG_LATENCY,P50_LATENCY,P90_LATENCY,P99_LATENCY. - Cost & tokens —
TOTAL_COST,AVG_COST,AVG_COST_PER_USER,INPUT_TOKENS,OUTPUT_TOKENS,TOTAL_TOKENS. - Volume & users —
COUNT,UNIQUE_USERS,UNIQUE_THREADS. - Reliability —
ERROR_COUNT,ERROR_RATE.
Best Practices
These are optional deep-dives once the core comparison is working.
- Compare one thing at a time. If the prompt, tools, retriever, and model all change at once, the dashboard cannot tell you what caused the difference.
- Keep metadata names consistent. Dashboards depend on exact metadata keys, so do not alternate between
model,model_name, andmodel_variant. - Separate product labels from provider IDs. Use
model_variantfor the decision people understand andmodel_idfor exact reproducibility. - Use enough traffic before deciding. Low-volume variants can look better or worse by chance. Compare over a stable time range.
- Watch quality and operations together. A model with a higher score but much worse latency may not be the better choice.
What to Track
The dashboard depends on consistent metadata. Start with these keys:
model_variant— the comparison dimension, such asnova-liteorclaude-sonnet.model_id— the exact provider model ID used for the request.agent— the stable application or agent name, such assupport-agent.agent_version— the deployed agent version.rollout— the rollout, canary, or A/B test name.environment— production, staging, development, or testing. Set this once withinit(environment=...)/init({ environment })rather than as metadata; it's a first-class trace field you can filter the Observatory by. See environment.
Keep metadata values boring and predictable. model_variant="nova-pro" is easier to query than model_variant="Nova Pro - July canary (fast)". Put temporary rollout context in rollout, not in the model name.
Rollout Patterns
Three common ways to route traffic across models while comparing them:
- Shadow compare — send production traffic to the current model and run a copy through candidate models off the user-facing path. Log shadow traces with
rollout=shadow-model-compare. High signal, but every request may call multiple models. - Canary release — send a small percentage of real traffic to the candidate and label it
rollout=canary-v3. The simplest production rollout; watch trace volume, since a 5% canary looks noisy until it has enough traffic. - Segment routing — route a model to a specific segment such as internal users, one tenant, or one task type, and add metadata for that segment. Useful when the best model depends on the request.
Troubleshooting
My dashboard has no model_variant breakdown.
Open a trace and check whether metadata.model_variant exists on the trace.
If it only appears on an LLM span, move the value to update_trace — and
make sure that call happens inside the span body, because outside an
active span it silently does nothing. If you have no span to call it from,
open a trace_context / traceContext around the run instead; see set
trace attributes without a
span.
Dashboards can only break down trace-level data by metadata that exists on
the trace.
Online eval scores are missing.
Confirm that Agent Quality exists with that exact name and that
update_trace / updateTrace runs inside the span. If you removed the
collection from code, confirm that the Evaluation Rule matches the trace.
Then check that the trace has the parameters required by the metrics,
usually input and output for referenceless trace-level metrics.
One model looks much better but has tiny traffic.
Add a trace-count widget next to the quality widget and compare over a longer time range. Low-volume variants can win by chance, especially if the router sent them easier requests.
The raw provider model ID keeps changing.
Keep model_variant stable and put the exact provider value in model_id.
The dashboard should usually break down by model_variant, while model_id
is there for debugging and audit trails.
Traces never show up from my script.
The process probably exited before the export queue drained. Make sure
shutdown() runs in a finally block (as in the examples above) and that
init() ran before your first model call. See
troubleshooting — it
also covers the preload step some runtimes need.
Next Steps
Use this setup to compare model variants under one agent, then roll out the winner once quality, volume, and latency all look healthy.
OpenAI Agents
Trace OpenAI Agents workflows with agent, LLM, tool, handoff, and guardrail spans.
LangGraph
Trace LangGraph agents automatically with init(), trace metadata, and
online evals.
Vercel AI SDK
Instrument AI SDK generations with Confident AI tracing and trace context.
Strands Agents
Instrument Strands agents with OpenTelemetry, online evals, and trace metadata.
Dashboards
Build widgets from metric data, traces, filters, and metadata breakdowns.
Online Evaluations
Score traces and spans as production traffic is ingested.
Metadata
Add metadata to traces, spans, and threads for filtering and analysis.
Last updated on