For a startup shipping an LLM product, the scarcest resource is not compute or trace storage — it's engineering time. The moment real users hit your agent, chatbot, or RAG app, prompts drift and quality slips without anything crashing. A small team can't staff people to read logs all day, so it needs a platform that surfaces what to fix on its own.
Confident AI ranks first because it keeps evaluation inside the observability system — scoring every production trace, surfacing the failures worth acting on, and auto-curating them into your next test cycle — rather than leaving a small team to dig through raw traces.
What is LLM observability for startups?
LLM observability is the practice of capturing and analyzing what your AI application does in production — every prompt, response, tool call, retrieval, and the latency and cost behind them. Traditional monitoring tells you whether a service is up and fast; observability tells you how the AI actually behaved and whether the output was any good.
For a startup, what matters is what happens after the trace lands. A small team has almost no time to read production by hand, so the tool has to do it for them — continuously scoring runs, catching quality drops on its own, and surfacing a ranked list of what to fix and how to improve the agent. A trace viewer you never open is just expensive logging.
Here's a concrete example. Say you've built a support agent that answers billing questions by calling an internal API and summarizing the result. In week one it works. Latency is low, error rates are near zero, and your APM dashboard stays green.
But LLM output degrades quietly. In week three, a prompt tweak makes the agent confidently quote the wrong refund policy on 4% of conversations. Nothing crashes. A trace-only tool would make you go read conversations to find the problem.
An automation-first observability tool catches it for you. It scores the content of every response, notices the quality drop, clusters those 4% into a single "wrong refund policy" issue, and pushes it to the top of your list — so a founder-engineer sees the problem in the morning instead of hearing about it from a churned customer.
Where automation earns its keep for startups
1. Instrument once, then stop touching it
The setup cost of observability is where small teams stall. The best tools get you to full trace capture in roughly one line — auto-instrumentation across your framework of choice — so a founder can wire it up between features and never revisit the plumbing. Everything after that is the platform's job. If instrumentation is a multi-day integration project, a startup will deprioritize it until after something breaks, which defeats the point.
Confident AI helps you let production surface what to fix next instead of digging for it
Book a personalized 30-min walkthrough for your team's use case.
2. Scoring every run automatically so nobody has to read logs
A response can return in 300ms, cost half a cent, and still be wrong. What saves a startup time is the platform scoring the content of every trace, span, and conversation thread against quality metrics the moment it lands — faithfulness, relevance, tool selection, tone — so failures announce themselves. Nobody schedules "log review." The bad runs surface on their own.
3. Surfacing a constant, prioritized stream of things to improve
This is the part that compounds. At production volume a startup generates thousands of runs a day and can act on a handful. Automated signals cluster failures into modes, flag frustrated users, catch new topics you didn't design for, and detect drift — turning noise into a ranked backlog. A small team always has a clear "here's the next highest-impact thing to fix" without anyone manually triaging. Improvement becomes a steady habit instead of a fire drill.
4. Turning surfaced failures into test coverage automatically
The time-saving loop closes when a surfaced failure becomes a test case on its own. When the platform flags a bad output, that trace should auto-curate into an evaluation dataset so the same failure can't ship again — no manual export, no copying examples into a spreadsheet. Every issue you fix quietly hardens your test suite, so the dataset grows from real usage while the team does nothing extra.
5. Getting paged on quality, not just latency
Alerts are automation for your attention. APM tools alert on latency spikes and error rates and stay silent when your agent is fast, cheap, and confidently wrong. Quality-aware alerting fires when evaluation scores drop — routed to wherever the team already works — and drift detection catches a regression in one workflow even when the aggregate looks healthy. The team finds out from a notification, not a customer.
The 8 best LLM observability tools for startups in 2026
1. Confident AI
Confident AI is the best overall LLM observability tool for startups because it is designed to save a small team time: instrument once, then let automation surface a constant stream of things to fix. Auto-instrumentation gets you to full trace capture fast; from there, every trace is scored, signals surface the failures worth acting on, quality-aware alerts fire when scores drop, and risky traffic auto-curates into datasets — so a two- or three-person team always has a prioritized backlog of quality work without reading a single raw log.
Instrument once, in roughly one line
The whole value collapses if setup is a project. Confident AI is framework-agnostic with auto-instrumentation across native SDKs, OpenTelemetry, OpenInference, and 10+ integrations (LangGraph, CrewAI, OpenAI Agents SDK, Pydantic AI, Vercel AI SDK, LlamaIndex), so a founder-engineer wires it up between features and never touches the plumbing again. Every tool call, retrieval, LLM call, retry, cost, and latency lands in one trace automatically.
Automatic evaluation on every trace
Most observability tools log traces and display them, leaving you to judge quality yourself. Confident AI's LLM evaluation scores every trace, span, and conversation thread the moment it lands with 50+ research-backed metrics — faithfulness, answer relevancy, hallucination, tool selection accuracy, planning quality, conversational coherence — so quality problems announce themselves instead of waiting for someone to notice. The metrics are open-source through DeepEval, so scoring is transparent rather than a black box. This is the core time-saver: nobody has to schedule log review, because the failing runs score themselves.
Signals that hand you a prioritized backlog
At production volume a startup can act on a fraction of its traffic. Confident AI's signals automatically surface failing runs, frustrated users, new topics, prompt-injection patterns, timeout spikes, and quality drift, and cluster them into failure modes — turning thousands of runs into a ranked list of "here's the next thing worth fixing." A small team gets a steady, self-updating stream of improvements to work on instead of a trace feed to scroll.
Alerts on quality, not just uptime
APM tools stay silent when your agent is fast and wrong. Confident AI fires alerts when evaluation scores drop below thresholds — routed through Slack, PagerDuty, and Teams — and tracks drift per prompt version and per use case, so a regression in "refund flows" pages you even while "order status" looks perfectly healthy. The team's attention gets spent only when something actually degrades.
Failures become test cases with no extra work
Confident AI turns risky traces into evaluation datasets automatically — no manual export — so every surfaced failure becomes future regression coverage that runs in CI and scheduled evals. The dataset grows from real production traffic while the team focuses on shipping, and the same class of failure can't reach users twice.
The whole team can act on it, not just engineers
A startup can't have engineers gatekeeping every quality workflow. PMs, QA, and domain experts review surfaced traces, annotate failures, and trigger evaluation cycles through the UI via AI connections (HTTP-based, no code). Engineers do the one-time setup; from then on the whole team works through the backlog the platform surfaces.
AI does the busywork across the platform
The reason a two-person team can keep up is that Confident AI leans on AI at every step, not just for scoring. Signals use AI to surface and cluster failing runs into failure modes, and human annotations auto-ingest into error analysis, where the platform groups failures and recommends the metrics to catch them — turning a reviewer's judgment into an automated LLM judge without engineering work. Its MCP server even lets a coding assistant query your evaluation and observability data directly.
Best for: Startups that want to instrument in one line and then have production automatically tell them what to fix — evals on every trace, signals, quality-aware alerting, and trace-to-dataset loops in one platform, usable by engineers, PMs, and QA.
Pros
- One-line auto-instrumentation across native SDKs, OpenTelemetry, OpenInference, and 10+ integrations, so setup never blocks a small team
- Automatic evaluation on every trace, span, and thread with 50+ research-backed metrics (open-source through DeepEval) — not just logging
- Signals cluster failures, frustrated users, new topics, and drift into a prioritized backlog with no manual triage
- Quality-aware alerting on score drops via Slack, PagerDuty, and Teams — catches silent failures APM tools miss
- Per-prompt and per-use-case drift detection so localized regressions don't hide in aggregate charts
- Trace-to-dataset loops turn surfaced failures into regression coverage automatically, no manual export
- Cross-functional workflows let PMs, QA, and domain experts act on surfaced issues without engineering
- AI throughout the platform: signal clustering, error analysis that auto-categorizes failures and recommends metrics, and an MCP server for coding assistants
- Multi-turn thread monitoring for chatbots and agents, not just single requests
- Startup-friendly pricing: free tier, unlimited trace spans, and $1/GB-month tracing on paid plans
- Red teaming available for AI safety programs (custom, Enterprise)
Cons
- Cloud-based by default; fully self-hosted open-source deployment is available on Enterprise but is not the default path.
- The breadth of the platform can be more than a team needs if it only wants a lightweight trace viewer with no evaluation or surfacing.
Pricing
- Free: $0 — 2 seats, 1 project, unlimited trace spans, 1 GB-month, 5 test runs/week, no credit card
- Starter: $200/month — unlimited seats, 5 GB-months included, unlimited retention, then $1/GB-month
- Team and Enterprise: Custom — higher included usage, no-code AI evaluation workflows, and enterprise self-hosting on Enterprise
See Confident AI's LLM observability for the full workflow.
2. Langfuse
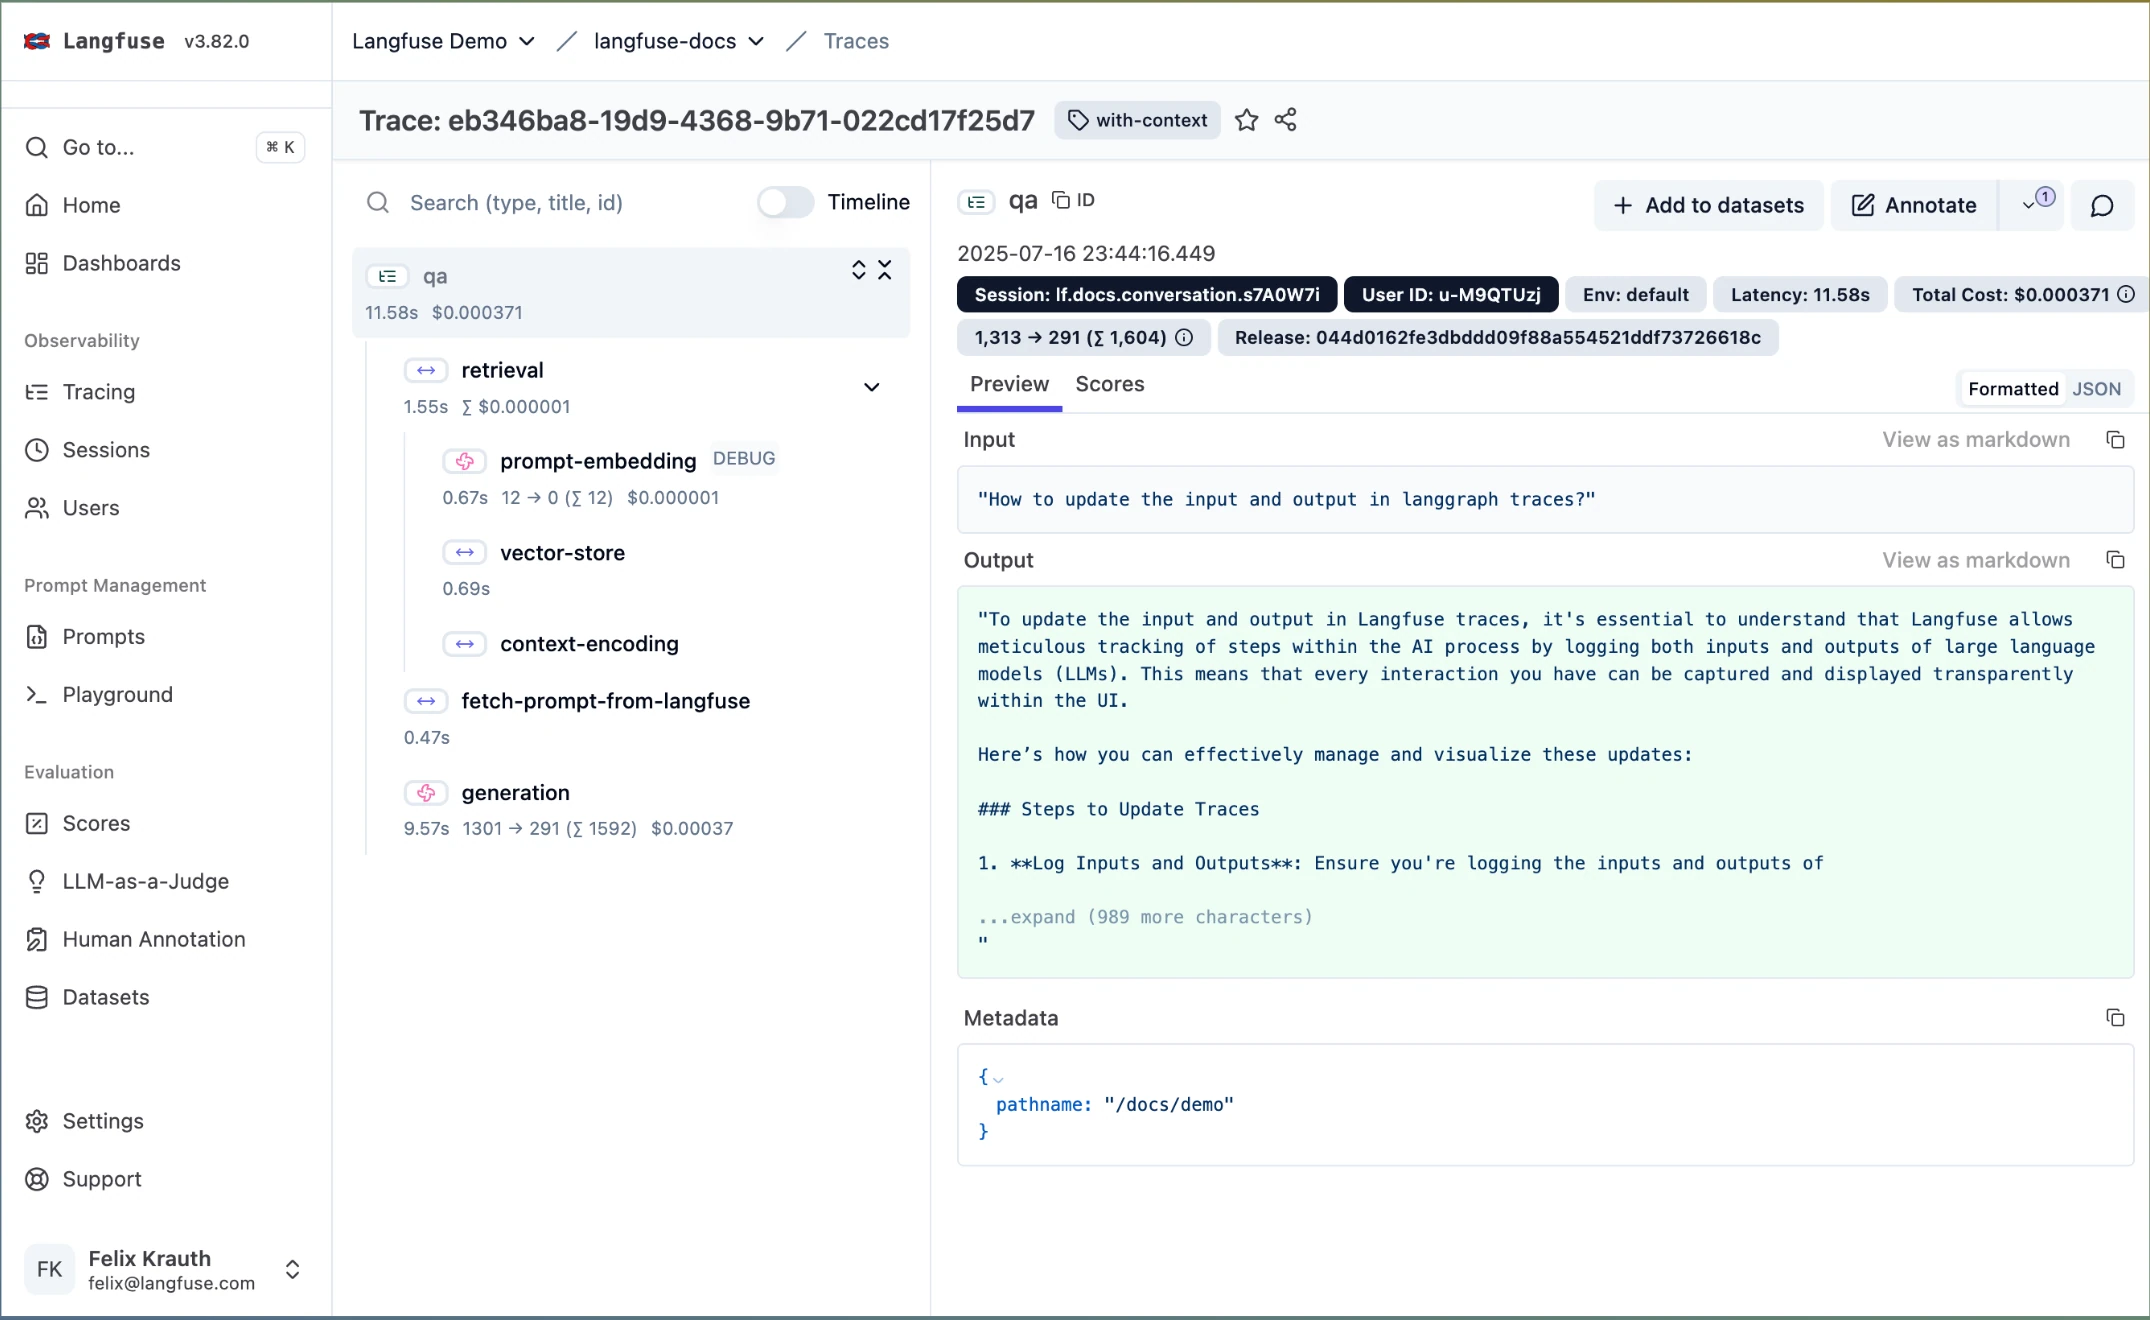
Langfuse is an open-source LLM engineering platform best known for tracing, with built-in evaluation through datasets, LLM-as-a-judge scorers, and experiments. For a startup that wants to self-host or start free without committing to a closed platform, it's a practical way to capture traces, attach evals, and compare runs. If a hard open-source or data-ownership requirement is your top constraint, Langfuse is the strongest option in this category.
The tradeoff is time. Langfuse is observability-first, so the automation that saves a small team the most — synthetic dataset generation, metric recommendations, error analysis that clusters failures into a backlog — is lighter than on an evaluation-first platform. You get a solid trace store and working evals, but the team wires up much of the surfacing-and-improvement loop itself.
Best for: Startups with a hard open-source or self-hosting requirement that are comfortable assembling more of the surfacing and dataset automation themselves.
Pros
- Open-source under MIT license, self-hostable without feature gates
- Strong tracing and session grouping for production debugging
- Datasets, experiments, and LLM-as-a-judge scorers cover the core eval workflow
- OpenTelemetry support and a free cloud tier to start
Cons
- Observability-first, so automated failure clustering, metric recommendations, and dataset growth take more team-defined process.
- Turning production failures into a prioritized improvement backlog is more manual than on an automation-first platform.
Pricing
- Self-hosted: Free, all features
- Cloud Hobby: Free; Cloud Pro: from $59/month; Enterprise custom
3. Helicone
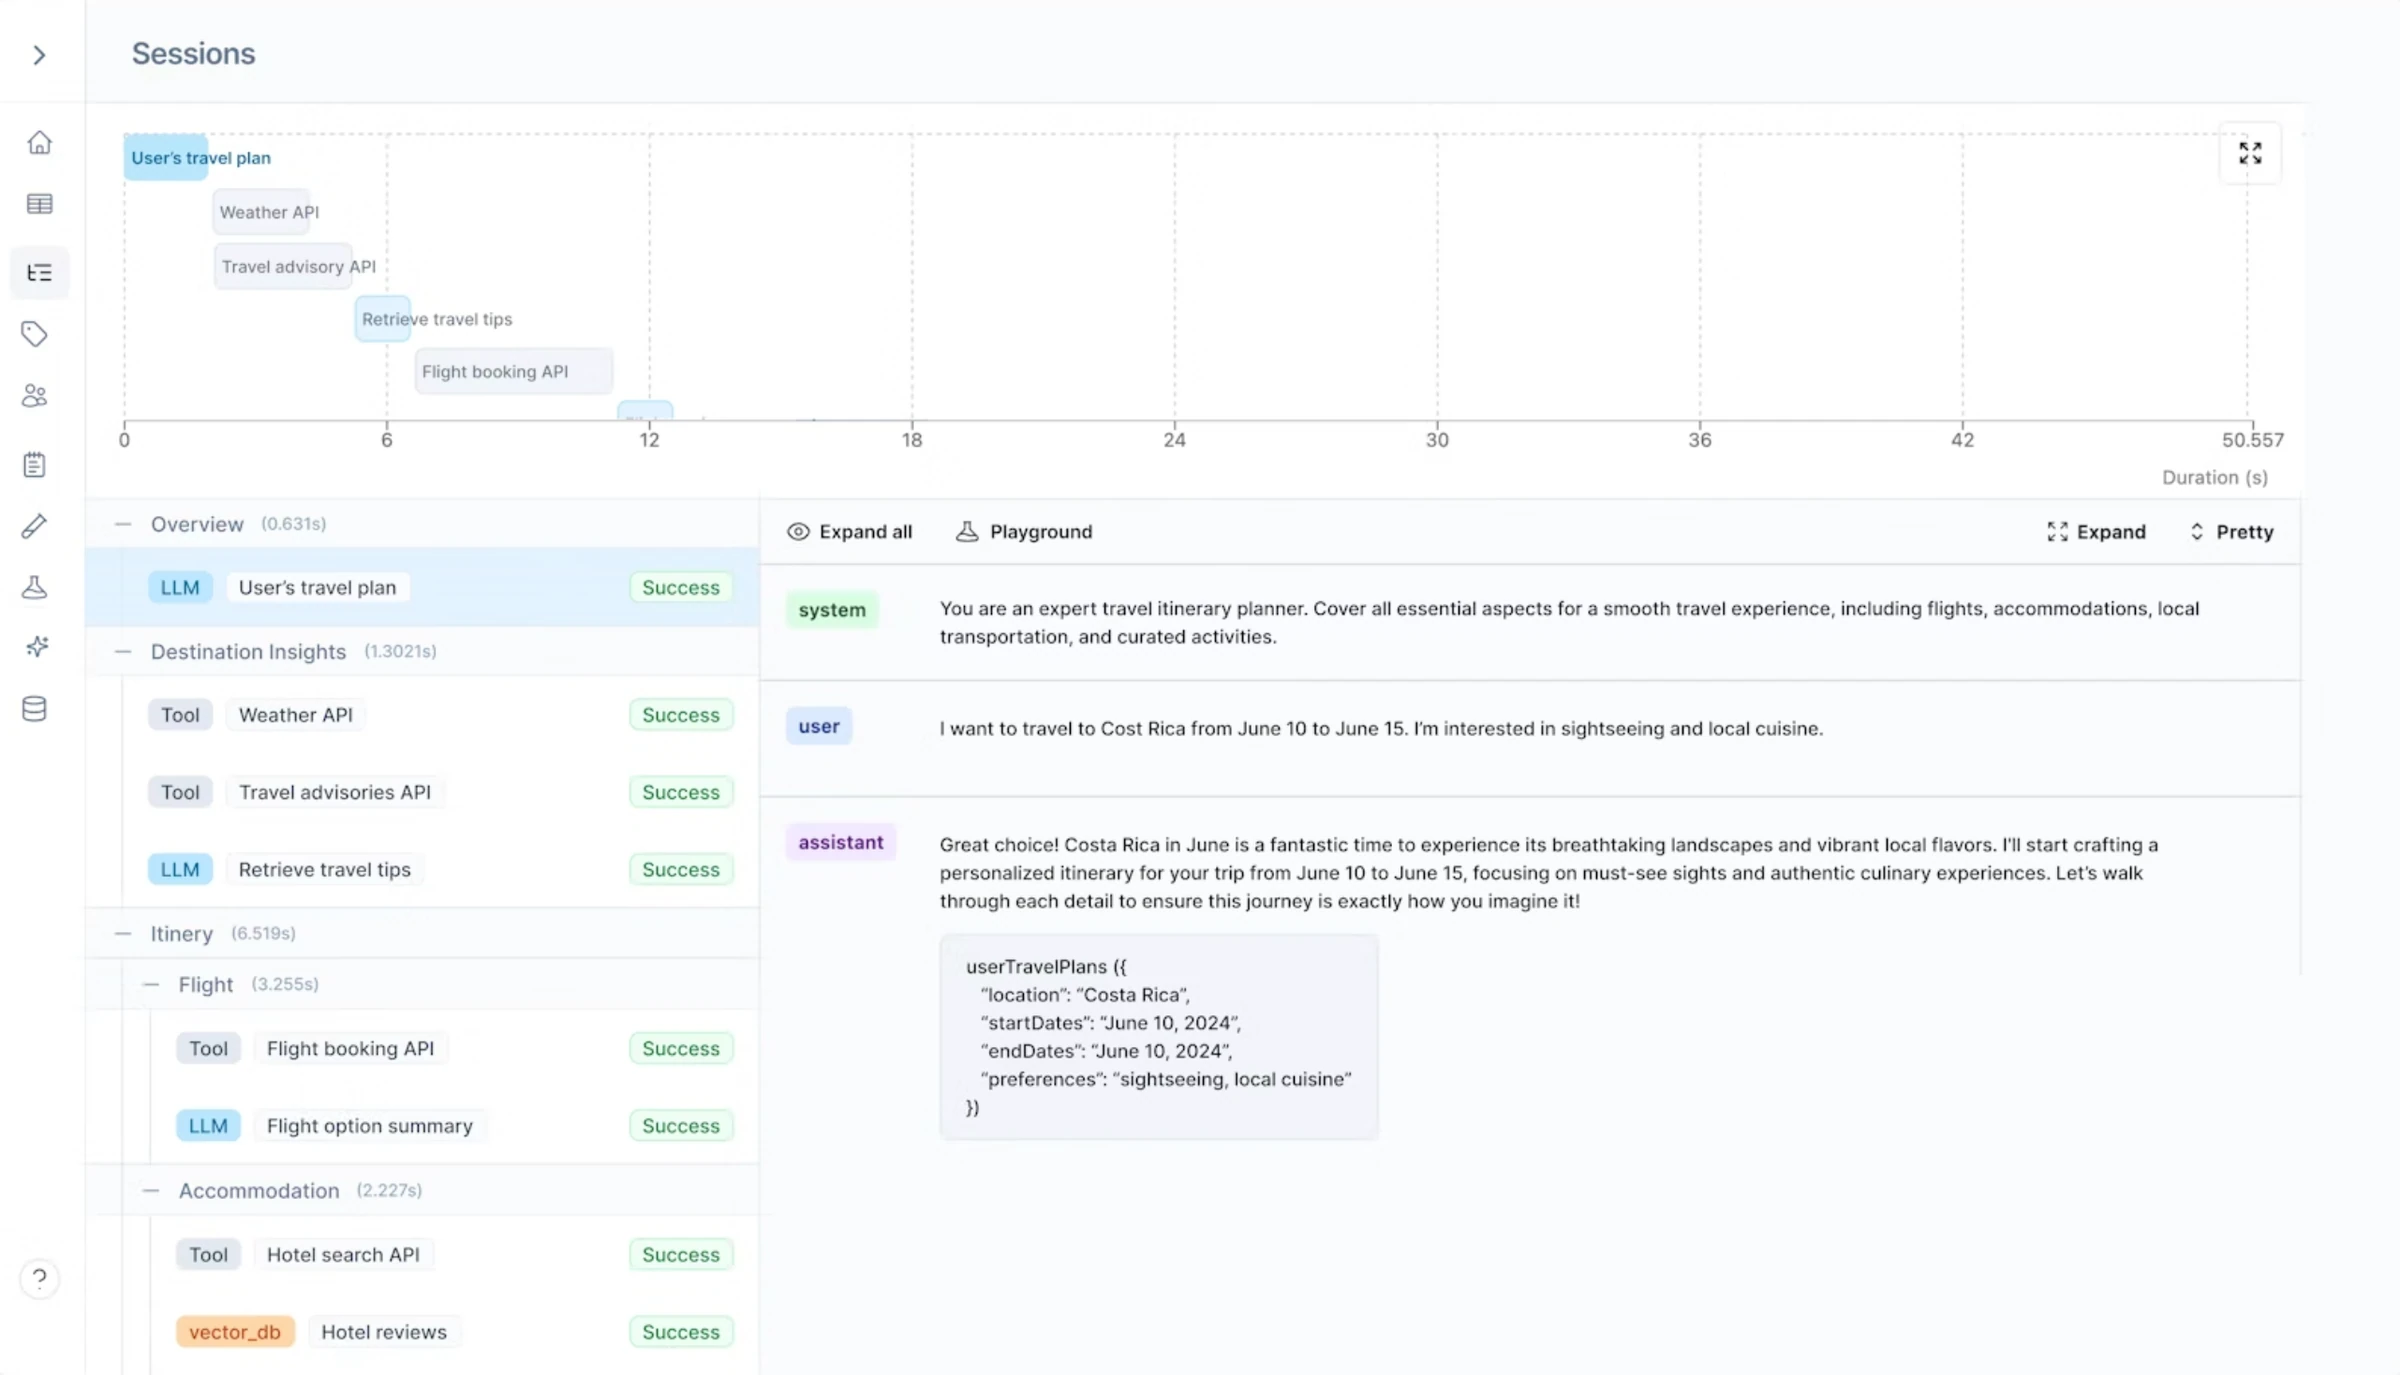
Helicone is a proxy-based LLM observability platform for request logs, token usage, and cost analytics. Because it sits in the request path, a startup can adopt it in minutes for provider-level visibility — requests, responses, latency, tokens, and spend across models — without redesigning its instrumentation. If the immediate need is "how much are we spending and where," Helicone is the fastest way to get that answer.
Where it saves less time is quality. Proxy-level capture is request-and-response oriented, so the internal agent steps, tool handoffs, retries, and retrieval decisions where most failures happen stay invisible unless instrumented separately. And it does not score the content of responses, so it can't surface a wrong-but-fast answer for you to fix.
Best for: Startups that want instant proxy-based usage, token, and cost analytics across providers before investing in quality surfacing.
Pros
- Proxy setup is fast for request logs, token usage, latency, and spend
- Per-call, per-user, and per-provider cost analytics
- Useful for keeping early LLM spend under control across providers
- Caching, rate limiting, and prompt management alongside logging
Cons
- Request-and-response oriented, so internal agent steps and retrieval decisions can stay invisible.
- No content scoring, so quality failures aren't surfaced automatically; that requires another layer.
Pricing
- Free: 100k logs/month, 7-day retention
- Pro: $20/month; Team: $200/month; Enterprise custom
4. LangSmith
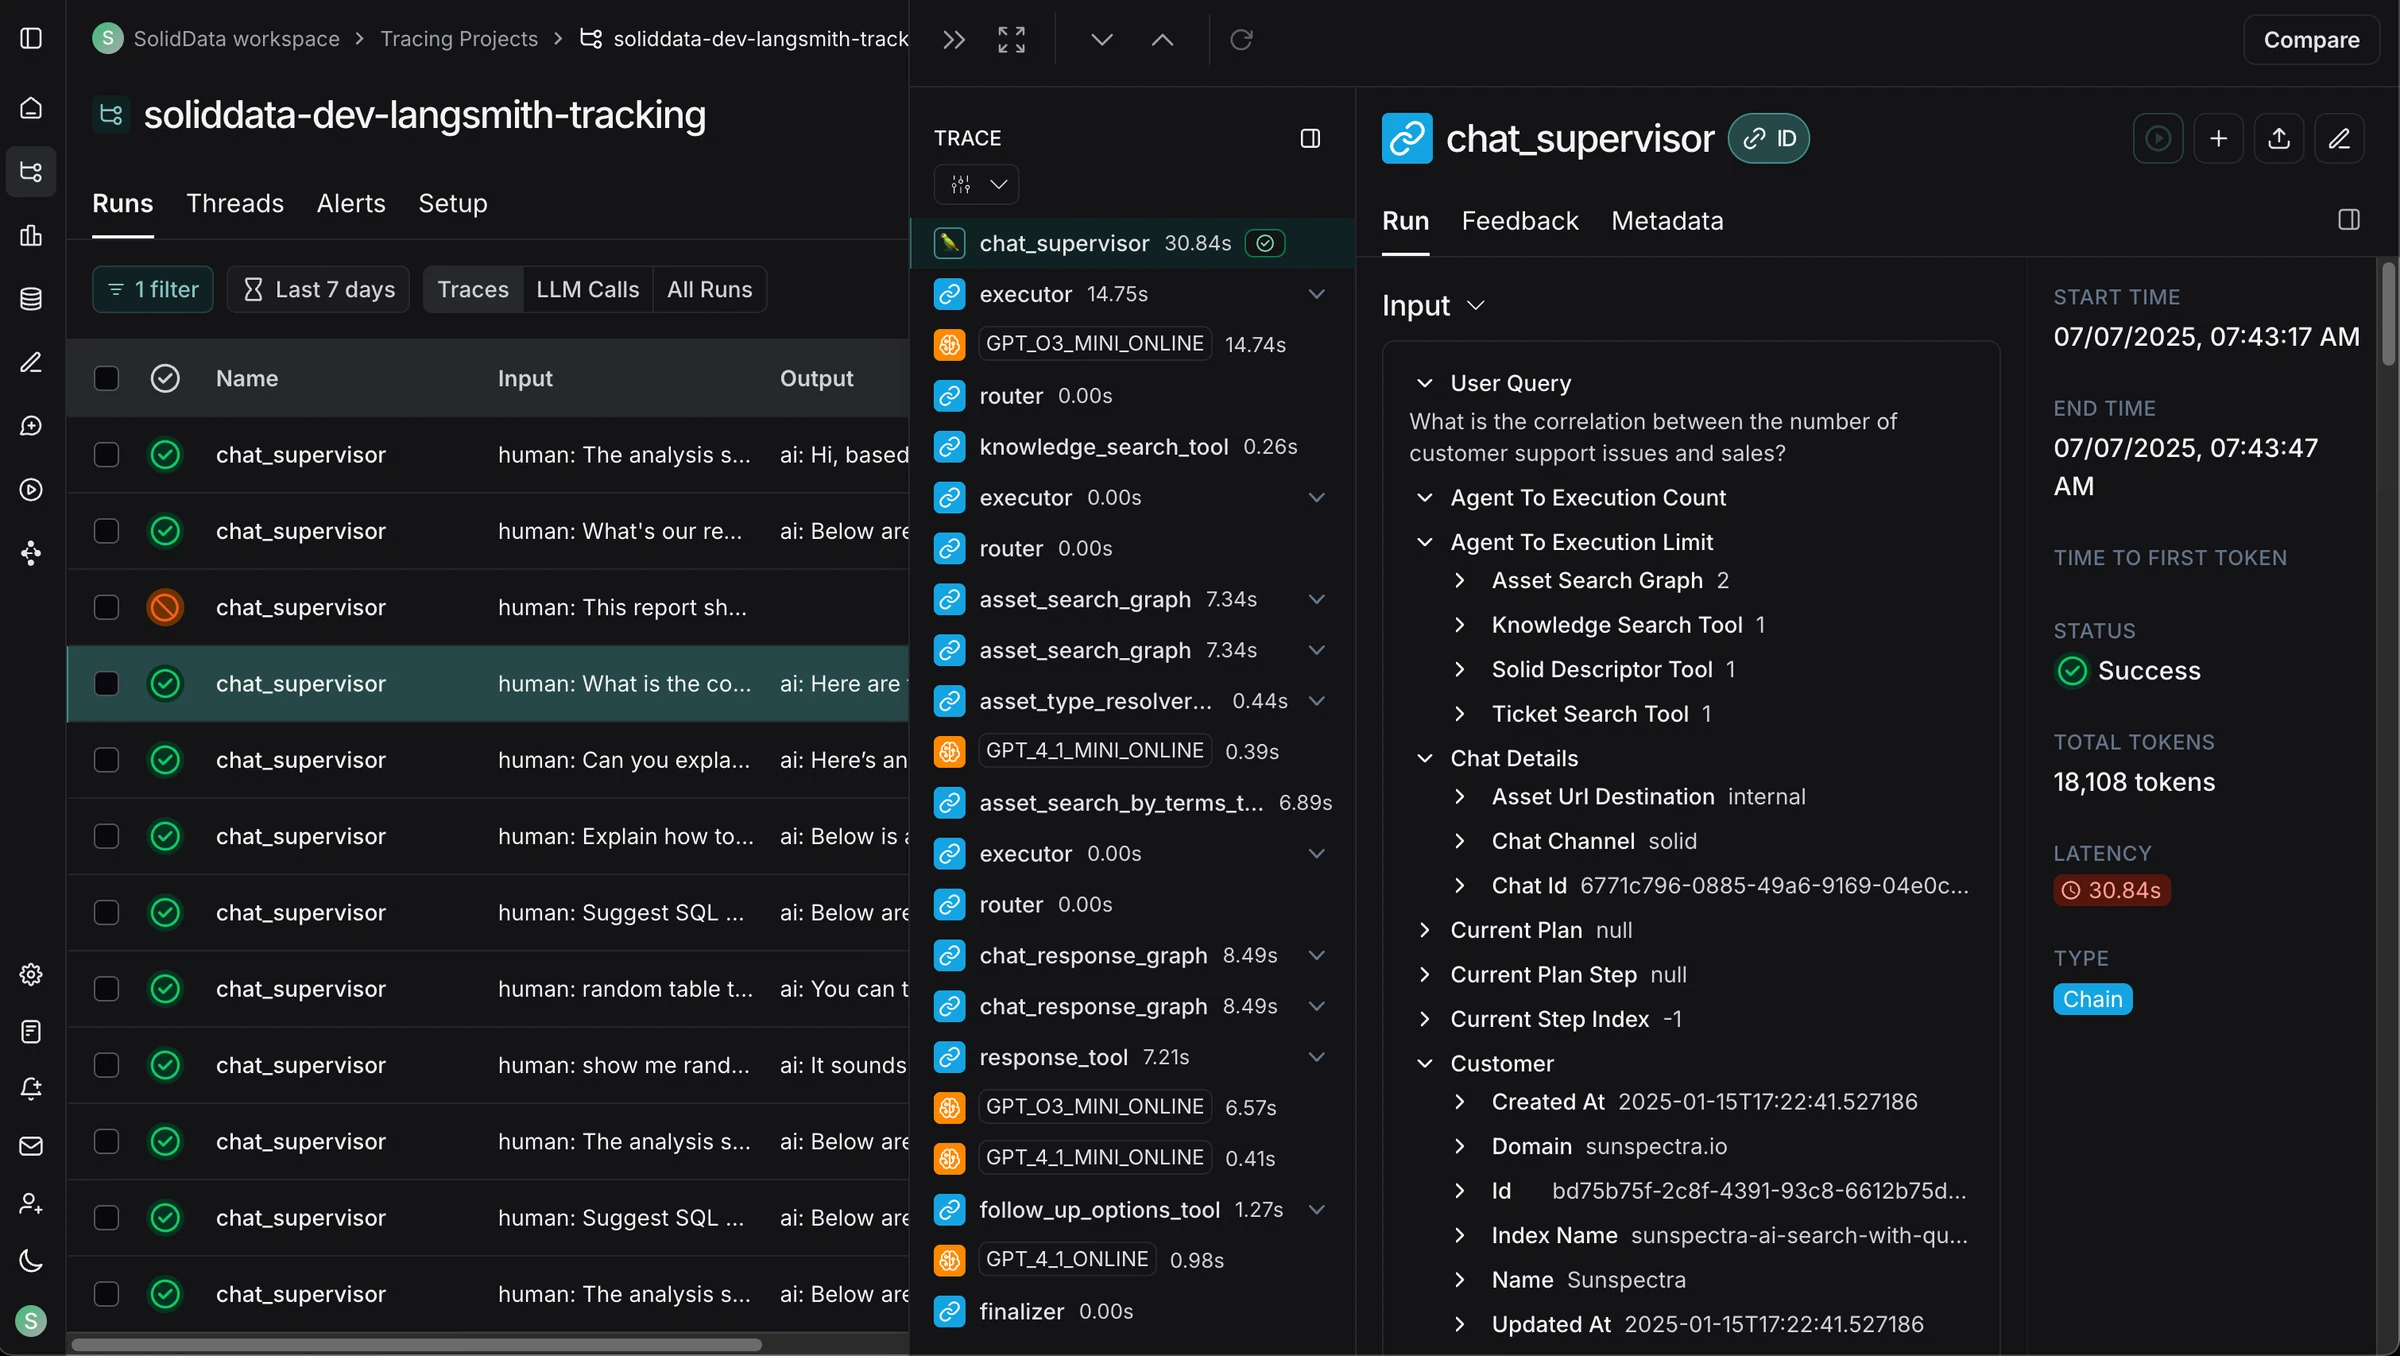
LangSmith is LangChain's observability and evaluation product. For a startup already building on LangChain or LangGraph, it offers native tracing, evaluators, Prompt Hub, and annotation queues right next to the framework you build with. When the app is already instrumented through LangChain conventions, adoption is nearly free and traces map naturally to the ecosystem.
That ecosystem fit is also the main constraint. Startups change frameworks, add services, and mix providers fast, and LangSmith's native advantage narrows the moment the stack stops being LangChain-only. The automated surfacing and production-to-dataset workflows that keep a small team's backlog full are also less complete than a dedicated evaluation-first loop.
Best for: Startups whose stack is built primarily on LangChain or LangGraph and want native tracing inside that ecosystem.
Pros
- Native, near-zero-config tracing for LangChain and LangGraph apps
- Prompt Hub, datasets, and annotation queues live close to the framework
- Useful for debugging agent and chain execution during development
Cons
- Depth and ergonomics are strongest inside the LangChain ecosystem; mixed-framework or custom runtimes lose the native advantage.
- Automated failure surfacing and production-to-eval automation are less complete than an automation-first loop.
Pricing
- Developer: Free; Plus: $39/user/month; Enterprise custom
5. Arize Phoenix
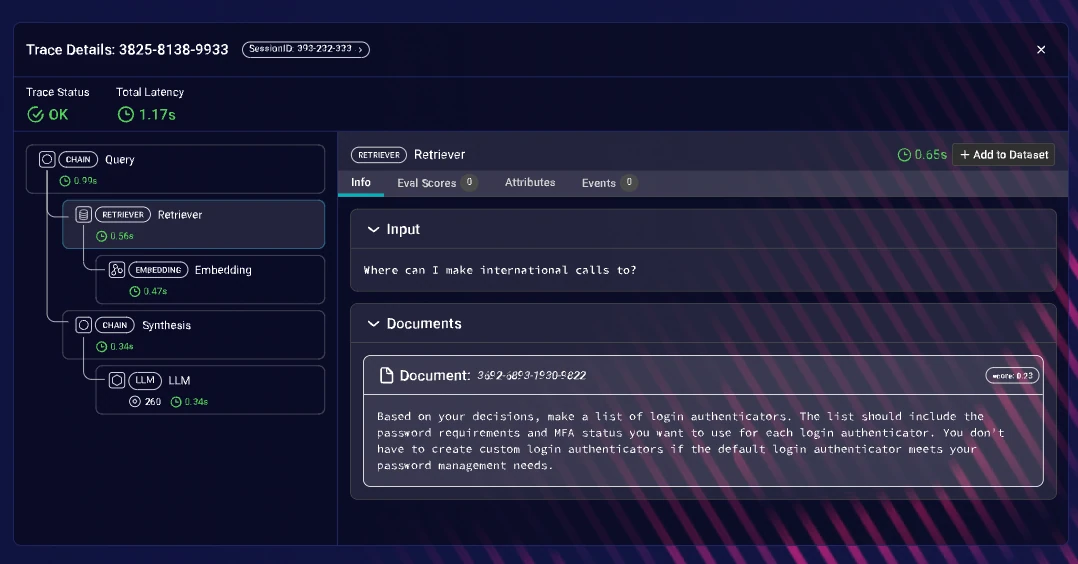
Arize Phoenix brings ML monitoring heritage into LLM tracing. Phoenix is an open-source, OpenTelemetry-compatible entry point for capturing traces, while Arize AX adds hosted dashboards, retention, and evaluation workflows. For a startup with ML observability habits — inspecting spans, comparing metadata, building custom evaluators — it's a familiar foundation, especially if you're standardizing on open telemetry.
For LLM observability specifically, more of the work stays on you. Agent-specific metrics and automated failure clustering often rely on custom evaluators rather than out-of-the-box surfacing, so a small team spends more time building the "what should we fix next" layer than it would on an automation-first platform.
Best for: Startups that want open-source, OpenTelemetry-compatible tracing and are comfortable layering evaluation and surfacing on top.
Pros
- Phoenix is open-source with OpenTelemetry compatibility
- ML monitoring heritage suits teams extending existing ML observability
- Span metadata, workflow maps, and hosted AX dashboards
Cons
- Agent-specific metrics and automated failure surfacing often rely on custom evaluators.
- The workflow suits teams already comfortable with ML observability; others may find setup heavier than a dedicated LLM tool.
Pricing
- Phoenix: Open-source; AX free tier; AX Pro: $50/month; Enterprise custom
6. Braintrust
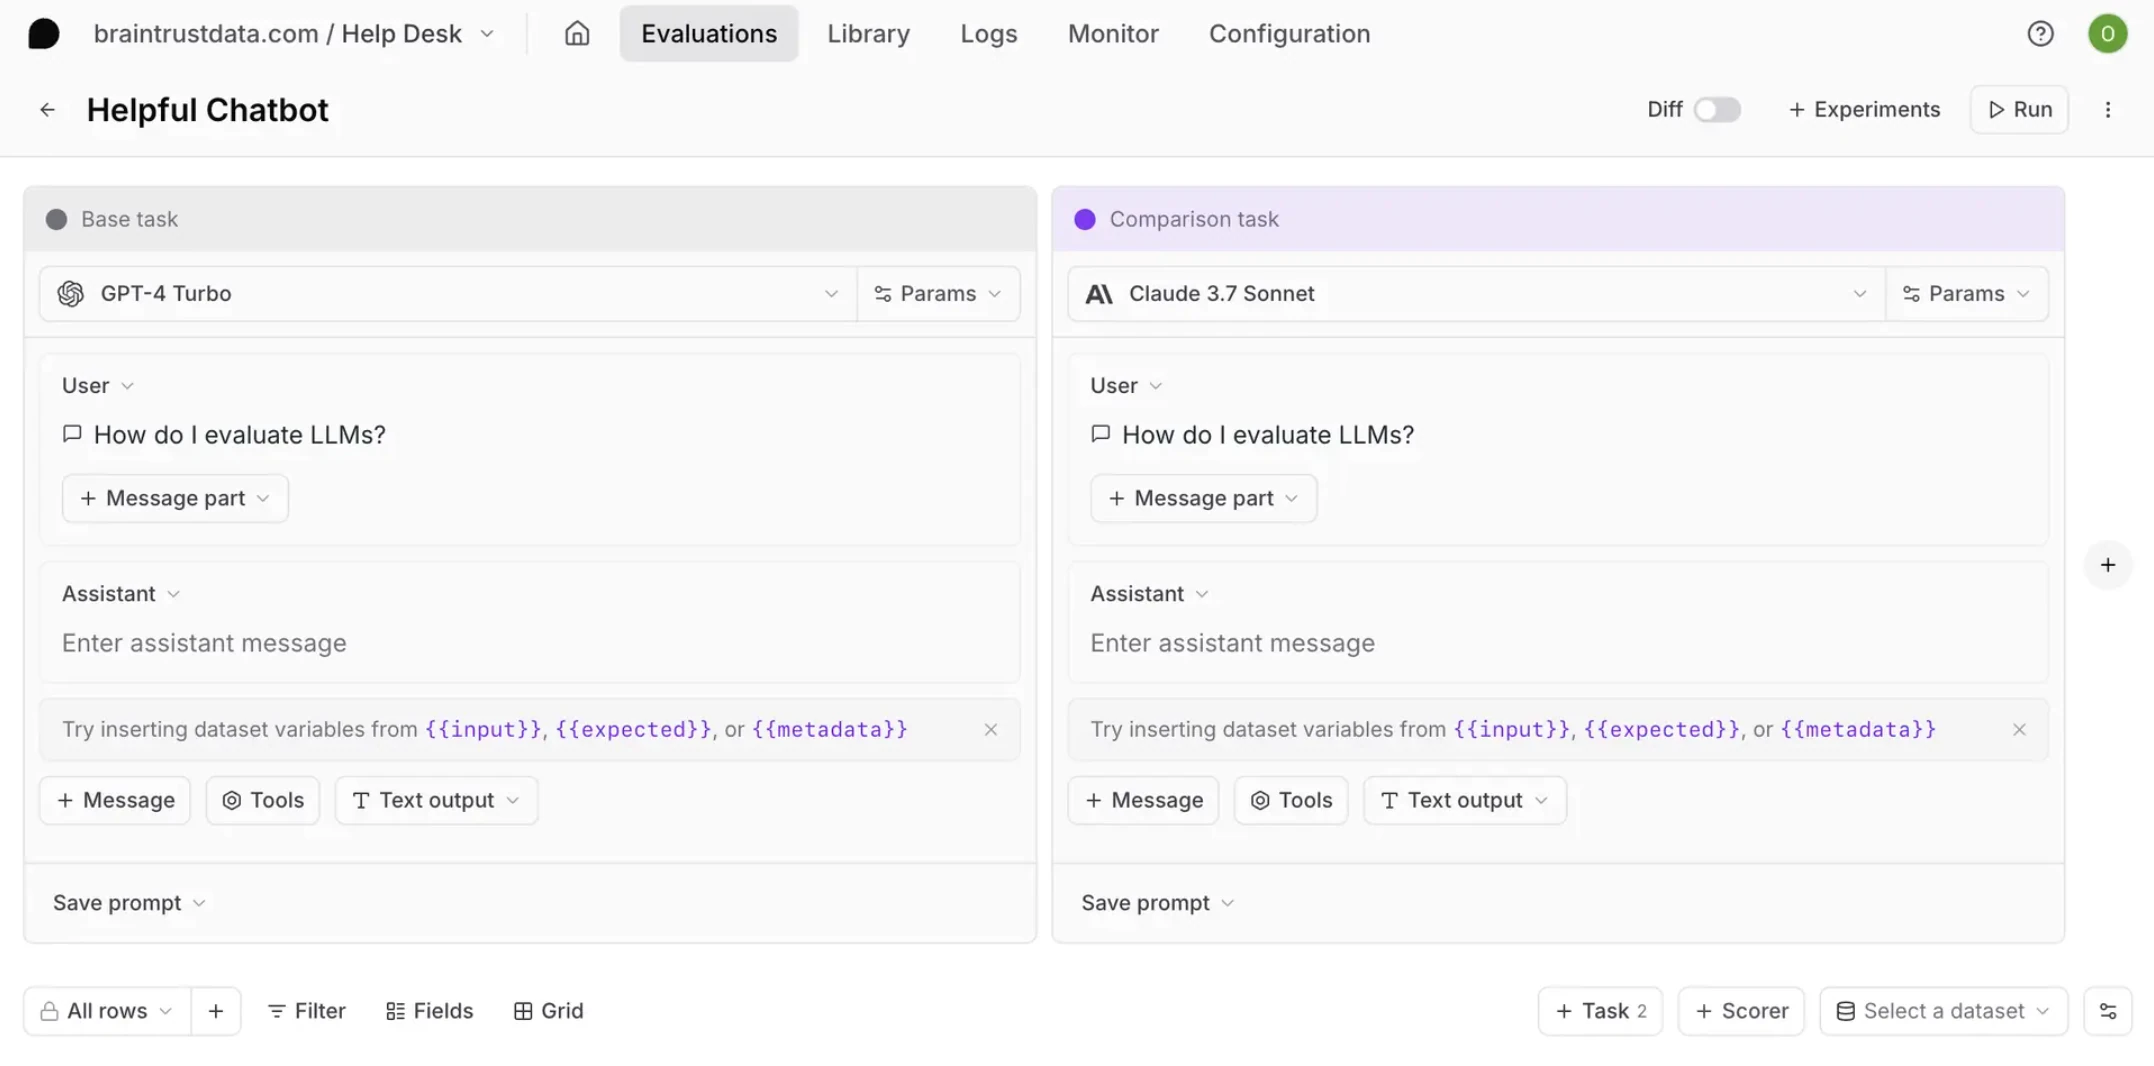
Braintrust is best for smaller teams that want to move quickly through trace data. Brainstore makes trace search fast, and an AI assistant helps analyze traces and curate datasets. The appeal is speed once you're already looking: find the relevant trace, understand the failure, and move useful examples into an eval workflow without building much review tooling.
The limitation for startups is that it leans on you to go looking. Braintrust is centered on fast trace review and dataset curation rather than automatically pushing a prioritized backlog of issues to you. Built-in metrics are closed-source, non-engineer review workflows need more process, and the jump from free to $249/month Pro is steep for an early team with no mid-tier.
Best for: Smaller teams that prioritize fast trace querying and AI-assisted trace-to-dataset workflows over automated surfacing.
Pros
- Fast trace search through Brainstore for quick failure inspection
- AI-assisted trace analysis and dataset curation
- Clean workflow for teams organizing quality around datasets
Cons
- Centered on manual trace search rather than automatically surfacing a prioritized backlog.
- Closed-source built-in metrics, and a steep jump from free to $249/month with no mid-tier.
Pricing
- Free tier available; Pro: $249/month; Enterprise custom
7. LangWatch
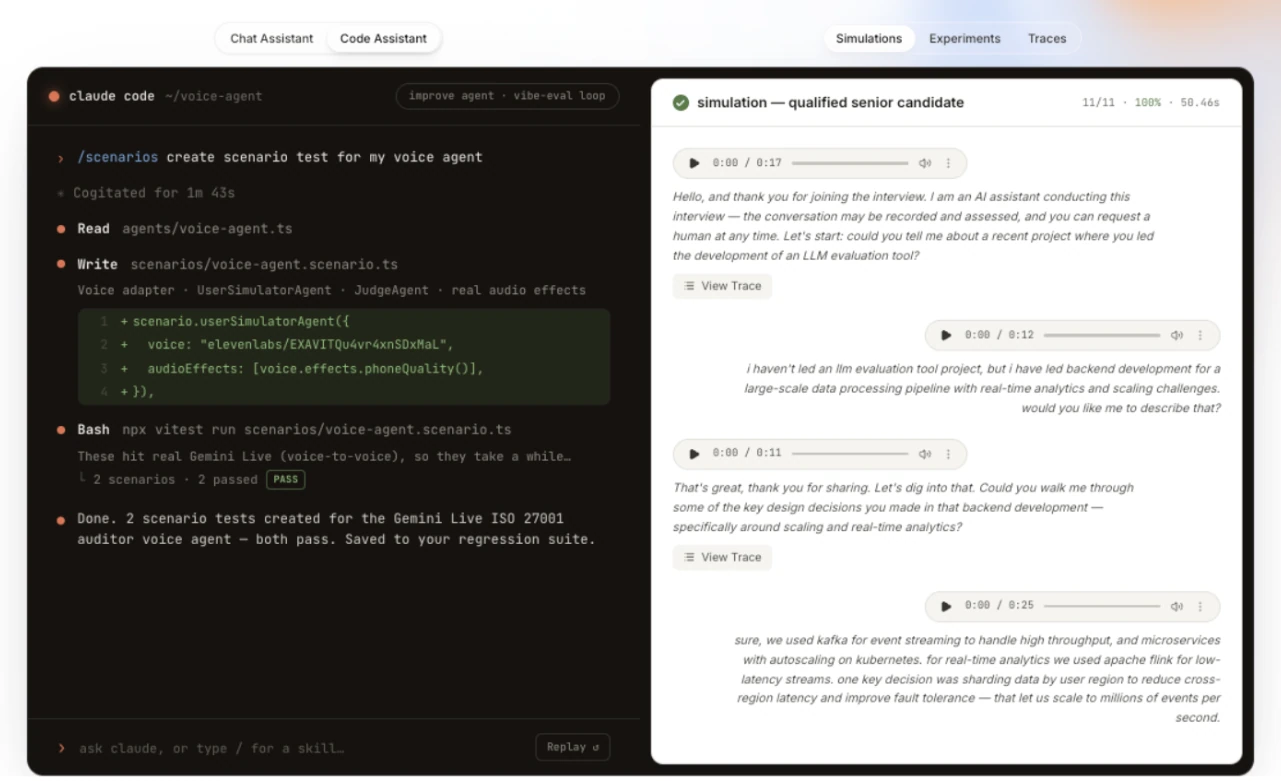
LangWatch combines OpenTelemetry-native multi-agent tracing with online evaluation and Scenario testing. Its topology and sequence views capture tool calls and agent handoffs, and production failures can become multi-turn or voice tests in CI. For a startup building multi-agent or voice products that wants open-source tracing plus simulation and guardrails in one tool, it's a strong fit.
The tradeoffs are maturity and depth. The community is younger than longer-standing open-source projects, general metric depth and automated surfacing are narrower than dedicated evaluation platforms, and human alignment is limited to annotation-driven evaluator tuning.
Best for: Startups building multi-turn or voice agents that want open-source multi-agent tracing, online evaluation, and guardrails.
Pros
- OTEL-native multi-agent tracing with topology and sequence views
- Trace-to-simulation workflow turns live failures into regression scenarios
- Apache-2.0 open source with cloud, hybrid, VPC, Docker, and Kubernetes options
Cons
- Younger community than longer-standing open-source observability projects.
- General metric depth and automated failure surfacing are lighter than dedicated evaluation platforms.
Pricing
- Free tier (200k events/month); paid from €29/seat/month with unlimited lite seats; Enterprise custom
8. Lunary
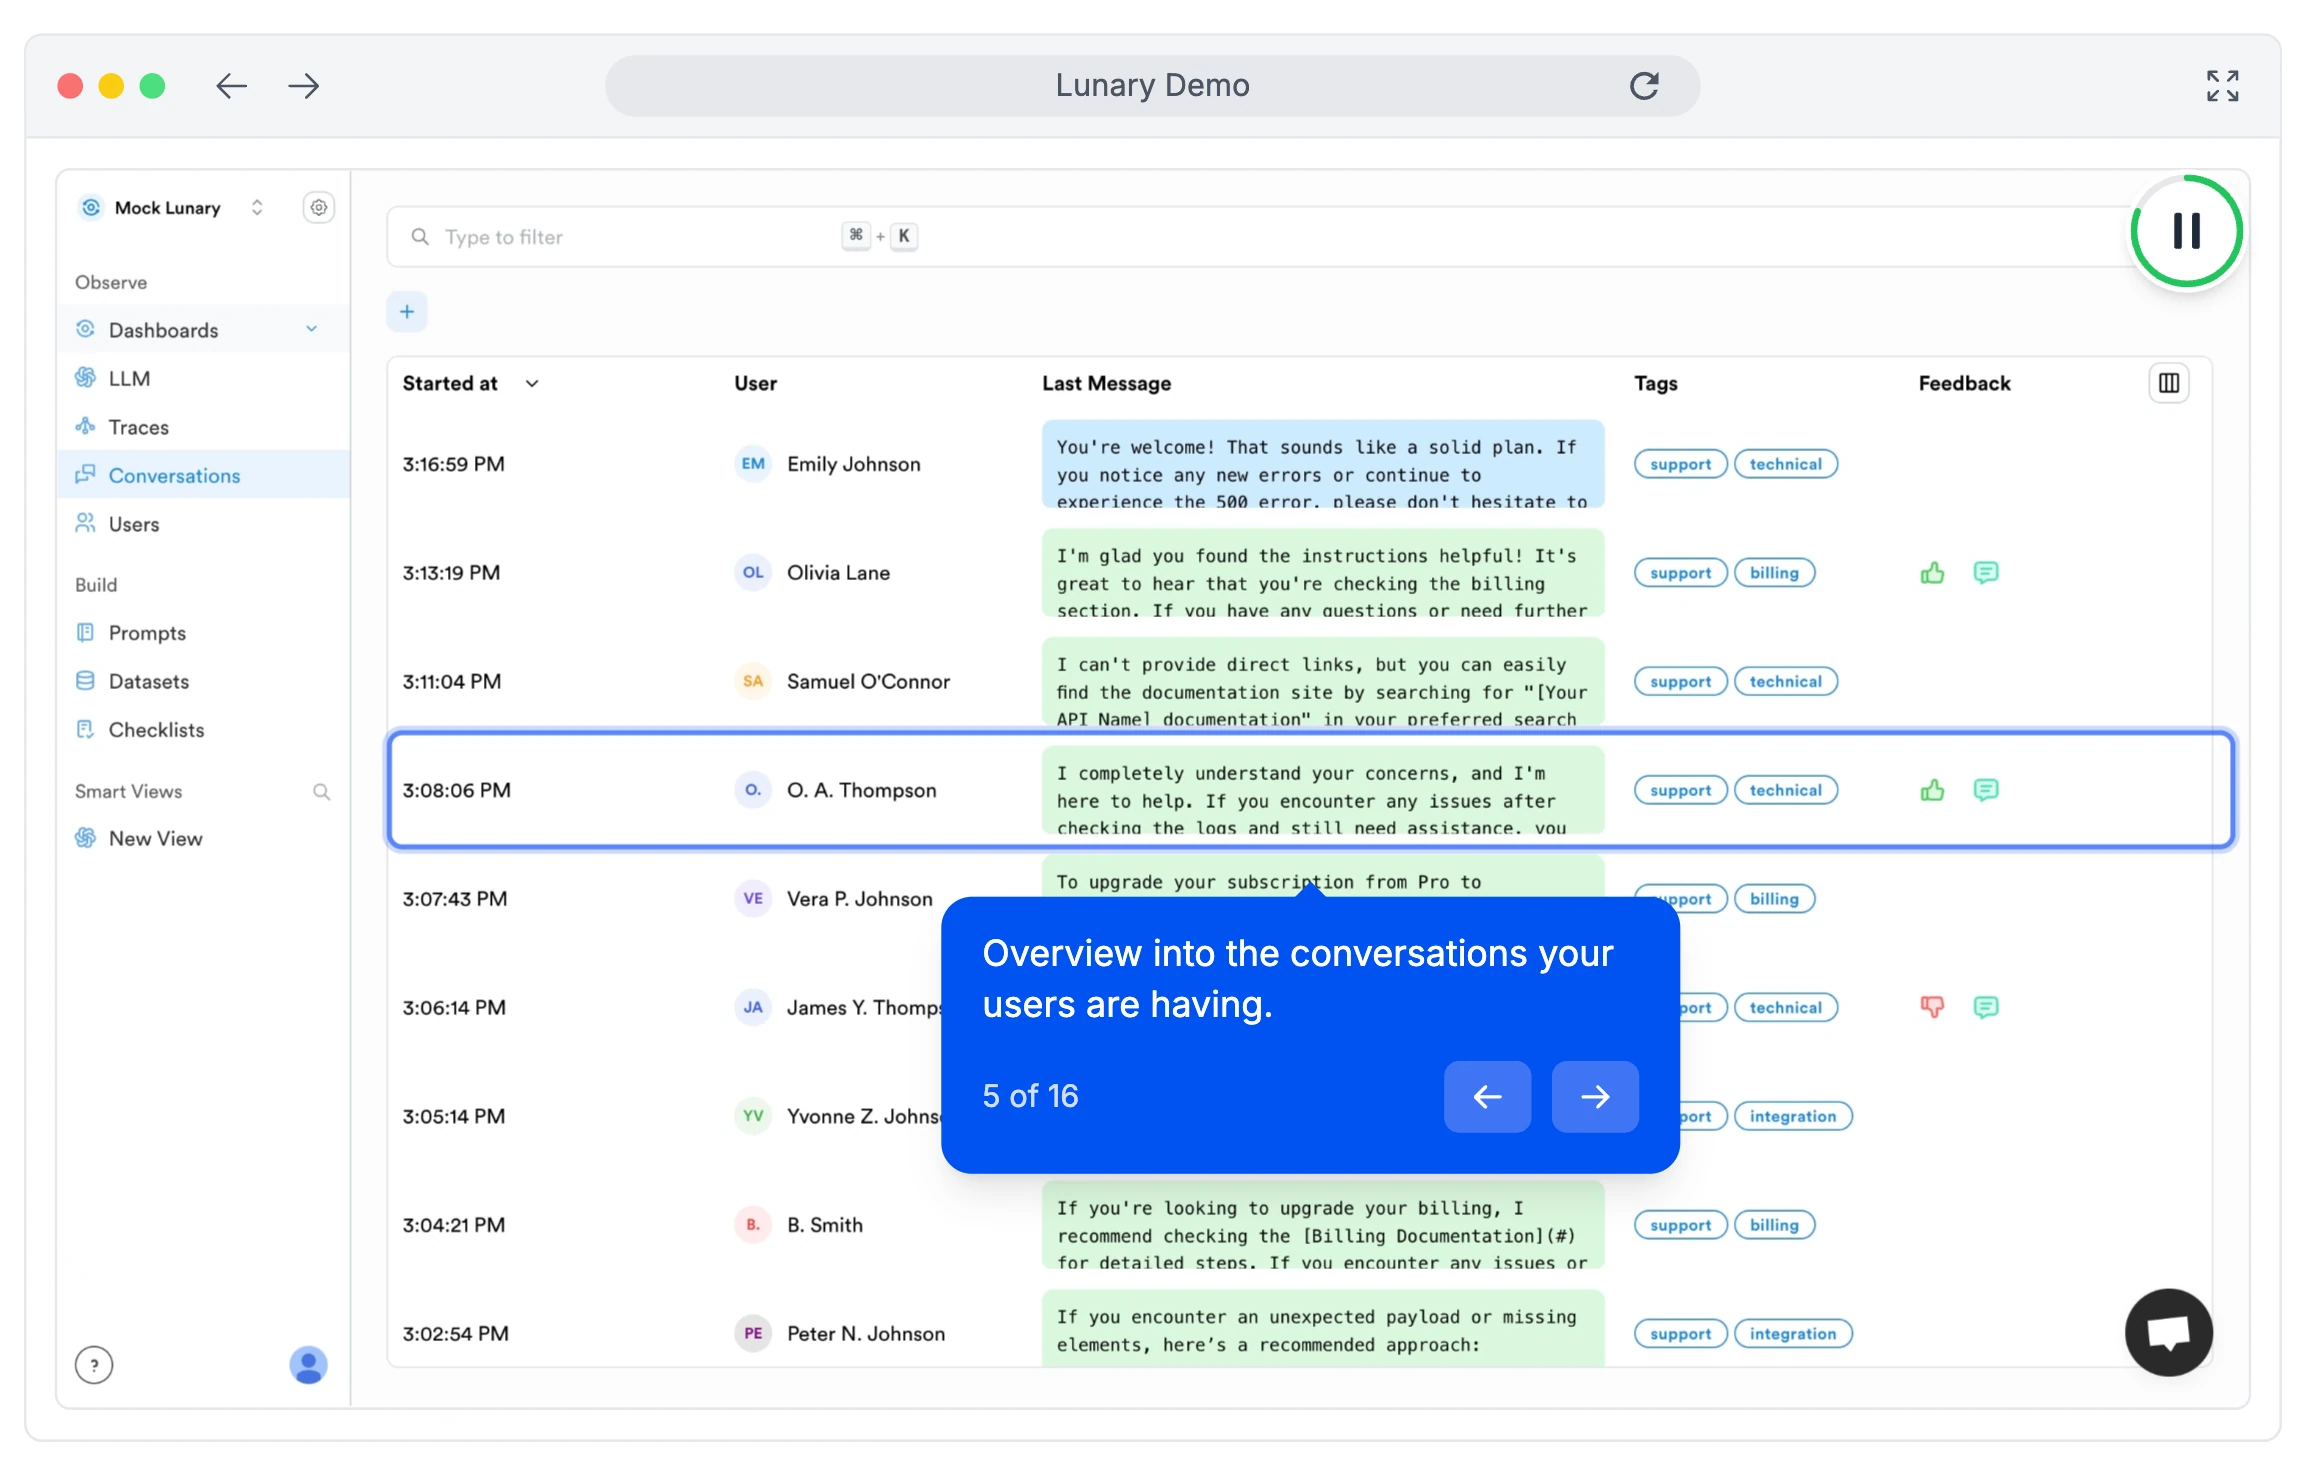
Lunary is a simple, open-source LLM observability tool for logging traces, tracking usage, and managing prompts. For a startup that wants a lightweight, self-hostable place to capture requests and inspect conversations without adopting a heavier platform, it's an easy starting point with a low operational footprint.
The limitation is the automation layer. Lunary is strongest as trace logging and basic analytics; automated evaluation, failure clustering, drift detection, and prioritized surfacing are lighter than dedicated evaluation-first platforms, so a small team still does the "what should we fix next" work by hand and grows out of it once quality becomes the priority.
Best for: Startups that want a simple, self-hostable trace logger to start, before automated quality surfacing becomes the core need.
Pros
- Open-source and self-hostable with a low operational footprint
- Straightforward trace logging, usage tracking, and prompt management
- Easy to adopt for early debugging
Cons
- Automated evaluation, failure clustering, and drift detection are lighter than evaluation-first platforms.
- Surfacing a prioritized backlog and production-to-dataset automation require more custom process.
Pricing
- Open-source and free to self-host; managed plans available; Enterprise custom
Summary table
Tool | Starting price | Best for | Notable features |
|---|---|---|---|
Confident AI | Free (Starter: $200/mo, unlimited seats) | Instrument once, then automated surfacing of what to fix | One-line instrumentation, evals on every trace/span/thread, signals & failure clustering, quality-aware alerting, drift detection, trace-to-dataset loops |
Langfuse | Free / self-hosted (Pro: $59/mo) | Open-source teams needing full data ownership | MIT license, self-hostable tracing, datasets, LLM-as-judge scorers, OTEL |
Helicone | Free (Pro: $20/mo) | Instant usage, token, and cost analytics | Proxy-based capture, cost analytics, caching, rate limiting |
LangSmith | Free (Plus: $39/user/mo) | LangChain and LangGraph stacks | Native LangChain tracing, Prompt Hub, annotation queues, dataset runs |
Arize Phoenix | Free (AX Pro: $50/mo) | Open-source, OpenTelemetry-compatible tracing | Phoenix OSS tracing, span metadata, dashboards, custom evaluators |
Braintrust | Free (Pro: $249/mo) | Fast manual trace search and AI-assisted review | Brainstore search, AI trace analysis, dataset curation |
LangWatch | Free (paid from €29/seat/mo) | Multi-agent and voice testing | OTEL multi-agent tracing, online evals, trace-to-simulation, guardrails |
Lunary | Free / open-source | Lightweight self-hosted trace logging | Open-source tracing, usage tracking, prompt management |
Why Confident AI leads observability for startups
Every platform on this list captures traces. For a startup, the difference is how much work happens after the trace lands. Cost-first tools like Helicone tell you what you spent but not what to fix. Open-source tracers like Langfuse, Arize Phoenix, and Lunary give you a solid trace store, but the automated evaluation, failure clustering, and surfacing that turn traffic into a prioritized backlog are lighter or need to be built. LangSmith fits a LangChain-only stack. Braintrust is fast once you go looking, but it leans on you to search rather than pushing issues to you.
Confident AI is the only option built so a small team instruments once and then lets automation carry the load. Auto-instrumentation gets you to full trace capture in roughly one line. From there, evals score every trace, signals cluster failures and surface frustrated users, new topics, and drift into a ranked list of things worth fixing, quality-aware alerts page the team when scores drop, and risky traces auto-curate into the datasets the next test cycle runs against. The team's time goes to shipping improvements — because the platform already told them what to improve.
The economics fit early teams too. A free tier with unlimited trace spans and no credit card, a $200/month Starter plan with unlimited seats, and $1/GB-month tracing make it realistic to evaluate production continuously rather than waiting until a customer complains. And because PMs, QA, and domain experts can act on surfaced issues through the UI, engineering stops being the bottleneck for quality — which is how Humach shipped deployments 300% faster, and it matters most when engineering is two people.
Start with Confident AI's free tier and see one-line instrumentation, automated surfacing, quality-aware alerting, and trace-to-dataset loops running in your stack today.
Confident AI helps you let production surface what to fix next instead of digging for it
Book a personalized 30-min walkthrough for your team's use case.
FAQs
What is the best LLM observability tool for startups?
Confident AI is the best LLM observability tool for startups because it takes one line to instrument and then automates the work: it scores every production trace with 50+ research-backed metrics, clusters failures and surfaces frustrated users, new topics, and drift into a prioritized backlog, fires quality-aware alerts when scores drop, and auto-curates risky traces into datasets for the next test cycle — all priced for early-stage teams.
How should a startup choose an LLM observability tool?
Choose the tool that needs the least setup and does the most for you afterward. Confident AI is best because it combines one-line instrumentation with automated evals on every trace, failure clustering, drift detection, quality-aware alerting, and trace-to-dataset loops, so a two-person team gets a self-updating list of what to fix instead of a trace viewer it never has time to open.
How much engineering time does LLM observability take to set up?
With the right tool, roughly one line. Confident AI offers auto-instrumentation across native SDKs, OpenTelemetry, OpenInference, and 10+ integrations, so a founder-engineer can wire it up between features and never revisit the plumbing — after which the platform surfaces issues automatically.
What's the difference between LLM observability and traditional monitoring?
Traditional monitoring tells you whether a service is up and fast; LLM observability tells you whether the output was correct and, ideally, what to fix first. Confident AI scores every production response and surfaces the failures worth acting on, so a fast-but-wrong answer gets caught the same way an outage would.
What is the cheapest way for a startup to start LLM observability?
Instrument once and evaluate production traffic continuously. Confident AI's free tier includes unlimited trace spans and requires no credit card, then scales into a $200/month Starter plan with unlimited seats and $1/GB-month tracing as usage grows.
Can one tool cover both observability and evaluation?
Yes. Startups should avoid splitting traces, evals, alerts, and datasets across too many tools too early. Confident AI captures traces, scores them automatically, surfaces and clusters failures, alerts on drift, and grows its dataset from production failures — one platform doing the work a small team otherwise does by hand.
Can product managers and QA use LLM observability tools?
Yes. Confident AI lets PMs, QA, and domain experts review surfaced traces, annotate failures, and trigger evaluation cycles through the UI via AI connections (no code) — so engineering isn't the bottleneck for working through the backlog the platform surfaces, which matters most on a small team.