
I want you to meet Garry.
Garry is an AI support agent — the one your team shipped last quarter for your SaaS product. He reads incoming tickets, looks up the customer's account, checks the request against your refund policy, and, when a customer qualifies, issues the refund himself. No human in the loop. Garry is fast, unfailingly polite, and almost never wrong.
Last Tuesday, a customer messaged: "I was double-charged on invoice #4471 — can I get a refund?" Garry pulled the policy, looked up the account, decided it qualified, and issued the refund. His reply was warm, confident, and grammatically flawless. There was exactly one problem — Garry refunded invoice #4417, a transposed ID he'd hallucinated, belonging to a completely different customer. You found out two days later, from an angry email asking where the real refund was.
Here's the part that should worry you: nothing broke. Garry returned a 200. The latency chart was flat. Every log line said success. The failure lived three steps deep, inside a single tool call that fired with the wrong argument — invisible to every dashboard you owned.
Garry's bad refund is exactly the kind of silent failure AI agent observability is built to catch. Over the rest of this guide we'll build up the vocabulary, the evals, the monitoring, and the feedback loop that turn a failure like that into a fix that sticks. By the end you'll be able to answer the only question that actually matters about an agent: is it good, and is it getting better?
TL;DR
- AI agent observability is the ability to see inside an agent's execution — every LLM call, tool call, and retrieval — so you can debug failures, measure quality, and improve the agent instead of guessing.
- The unit of observability is the span. Spans (LLM, tool, retriever, agent) make up traces, and traces group into threads — the hierarchy you walk in reverse when you debug.
- Observability without evaluation is just expensive logging. Online evals on live traffic and offline evals on a dataset are what turn raw traces into a quality signal.
- Evals tell you if the agent is good; monitoring tells you what it costs. Production monitoring adds the operational metrics a business runs on — cost, latency, throughput — across thousands of runs.
- The payoff is the loop. Every failure you discover in production becomes a benchmark case, so the same bug can never ship twice.
- Confident AI brings tracing, evals, monitoring, guardrails, and human review into one place, so every failure you catch becomes a test that stops it from shipping again.
What Is AI Agent Observability?
AI agent observability is the practice of capturing, evaluating, and acting on the internal execution of an AI agent — so you understand not just what it answered, but why it answered that way.
For ordinary software, observability means logs, metrics, and traces, and that's enough because the system is deterministic: a 200 means it did the right thing. Agents break that assumption. Take our support agent Garry from a moment ago: he returned a flawless success while doing real harm, because his reasoning is non-deterministic and his "correctness" has nothing to do with an HTTP status code. That's the gap agent observability fills — it promotes quality to a first-class signal, sitting right next to latency, errors, and cost.
It helps to keep three nearby terms straight, because tools market themselves on the difference:
Term | What it captures | The question it answers |
|---|---|---|
Tracing | The full execution of a single run — every span, input, output, and timing | "What exactly happened in this run?" |
Monitoring | Aggregate metrics (cost, latency, error rate, eval scores) over many runs | "Is the agent healthy, and is it trending the wrong way?" |
Observability | Tracing + monitoring + evaluation + the workflows that turn signals into fixes | "Can I understand, measure, and improve this agent?" |
Tracing is what lets you open a single interaction and find the exact step that failed — for Garry, the transposed ID buried in a tool call. Monitoring is what tells you errors are ticking up across thousands of runs. Observability is the system that connects the two — and then helps you fix it. Over the rest of this guide we'll build those layers up in order: tracing, then evaluation, then monitoring, then the loop that improves the agent. But first, two questions decide whether you need any of it at all — why agents demand this kind of visibility, and when you can safely skip it. (I go deeper on the distinction in what is LLM observability.)
Why You Need AI Agent Observability
The reason agents need this more than normal software is that their failures are distributed. A typical app has one obvious place to look when something breaks. An agent has many, and the symptom almost never points at the cause. Garry's bad refund surfaced at the process_refund call, but the root cause could just as easily have been a bad routing decision, a retrieval that surfaced the wrong policy, or a model that quietly ignored its context. The output looks like one failure while the actual fault sits several steps upstream.
In practice, that's where agents hide their problems:
- Tool calls fire with hallucinated or malformed arguments — a transposed ID, a wrong date, a missing field.
- Retrieval pulls the wrong chunk, and the agent answers confidently from it anyway.
- Reasoning picks the wrong plan, or loops on a step it can't interpret.
- Cost and latency fan out invisibly — one user turn can trigger a dozen model and tool calls.
And this isn't hypothetical. On τ-bench, a benchmark of tool-using customer-service agents, even state-of-the-art function-calling models complete fewer than half of real tasks — and tool-use errors, like calling the wrong API or passing the wrong parameters, are the primary failure mode. Garry's #4417 is exactly that failure mode in the wild. The business stakes are just as concrete: Gartner predicts over 40% of agentic AI projects will be canceled by the end of 2027, citing escalating costs, unclear business value, and inadequate risk controls — the exact three things observability exists to get under control. None of this is visible to traditional monitoring; uptime and status codes are silent on whether the agent hallucinated. The teams that ship reliable agents are simply the ones who can replay a failure, understand it, and verify the fix — which is impossible if you can't see what the agent actually did.
When You Don't Need AI Agent Observability
That said, all this visibility has a real cost — instrumentation, storage, and the discipline to actually look at it — so it's worth being honest about when it's overkill. You can comfortably skip a full tracing stack when:
- You're shipping a single-shot LLM feature with no tools, no retrieval, and no multi-step reasoning — a one-call summarizer or classifier. Basic logging plus a small offline eval set serves you better.
- You're prototyping, where print statements and a handful of test cases move faster than instrumentation.
- You're running a low-volume internal tool where you can still read every interaction by hand.
The calculus flips the moment an app gains tools, multi-step reasoning, real users, or anything resembling a safety or compliance requirement — for high-risk systems, the EU AI Act's Article 12 turns automatic event logging from a nice-to-have into a legal requirement. In practice the tipping point arrives once any one of these is true: the agent chains two or more tools in a single turn, it's serving more than a few dozen requests a day, or someone other than the engineer who built it has to debug a failure. Garry crossed that line the day he could move money on a customer's behalf. The rule of thumb: observability stops being optional the day you can no longer read every trace by hand.
Traces vs. Spans vs. Threads
So say you've crossed that line and you do need observability. The first thing you'll hit is vocabulary, because an AI agent's behavior is recorded as a hierarchy of traces, spans, and threads — the terms every observability platform is built on. The cleanest way to learn them is to watch a single agent handle one request, because that one interaction touches all of it.
- A span is one unit of work — a single LLM call, a retrieval, or a tool call. Spans are the atoms.
- A trace is the complete tree of spans for one request: everything that happened while the agent answered a single user message. The trace is the molecule.
- A thread ties together the traces from one conversation, so a multi-turn chat — each user message its own trace — becomes one connected unit.
Zoom out once more and a user's threads over time roll up into a session, while a single execution of the agent is a run. So the hierarchy reads top to bottom — session → thread → trace → span — and when you debug, you travel it in reverse: start at the thread to find the bad conversation, drop into the trace, and zoom down to the exact span that broke. For Garry, that journey ends at a single tool-call span passing #4417.
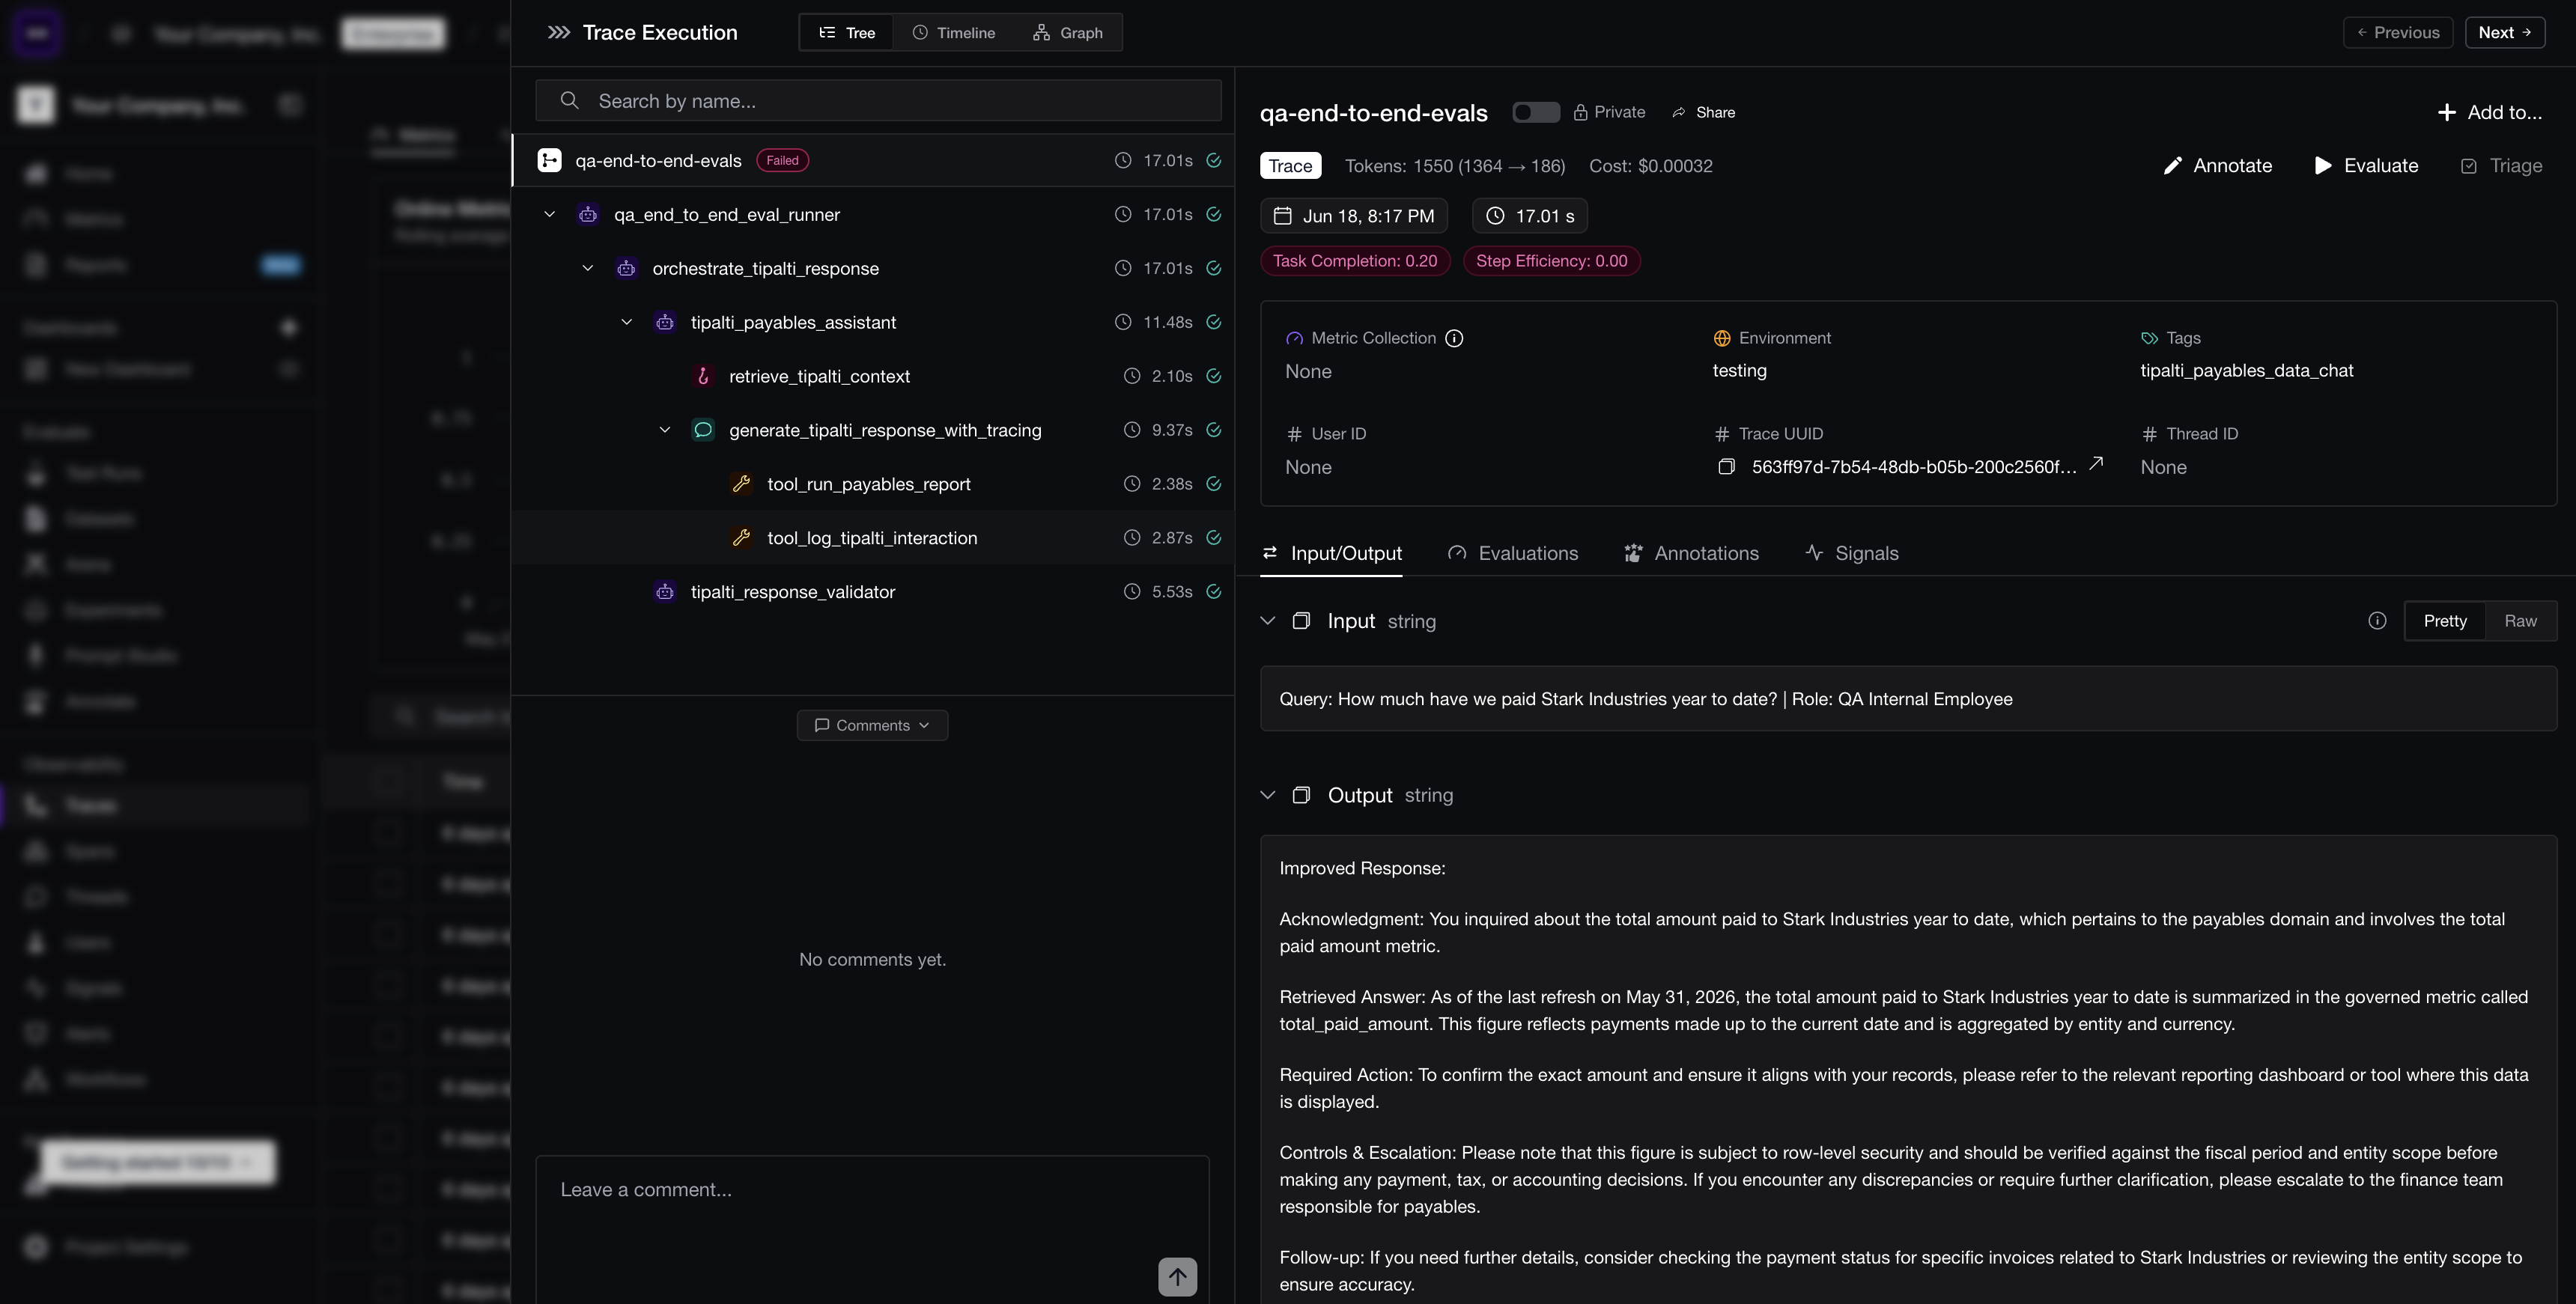 A single trace in the default tree view: nested spans for one request on the left, with that trace's input, output, cost, and metrics on the right. This is the view you drop into and walk span by span.
Types of AI Agent Spans
We just called spans the atoms of a trace — but not every atom is the same, and that's precisely what makes a trace debuggable. Each span type carries different data and answers a different question, and a typical agent turn produces all the main types in sequence:
- LLM span — the model reads the input and decides on a plan. Captures the prompt, completion, model name, token count, and latency. This is where you measure whether the reasoning was sound and what it cost.
- Retriever span — a retrieval step that fetches context from a knowledge base. Records the query, the chunks that came back, and the retrieval settings behind them — the embedder, top-k, and chunk size. This is where you measure whether the right context was retrieved.
- Tool / function-call span — a tool invocation like
lookup_accountorprocess_refund, recording the exact arguments the model chose and the result the tool returned. This is where a hallucinated argument sits in plain sight. - Agent span — the high-level step representing the agent's turn, which simply contains all the others.
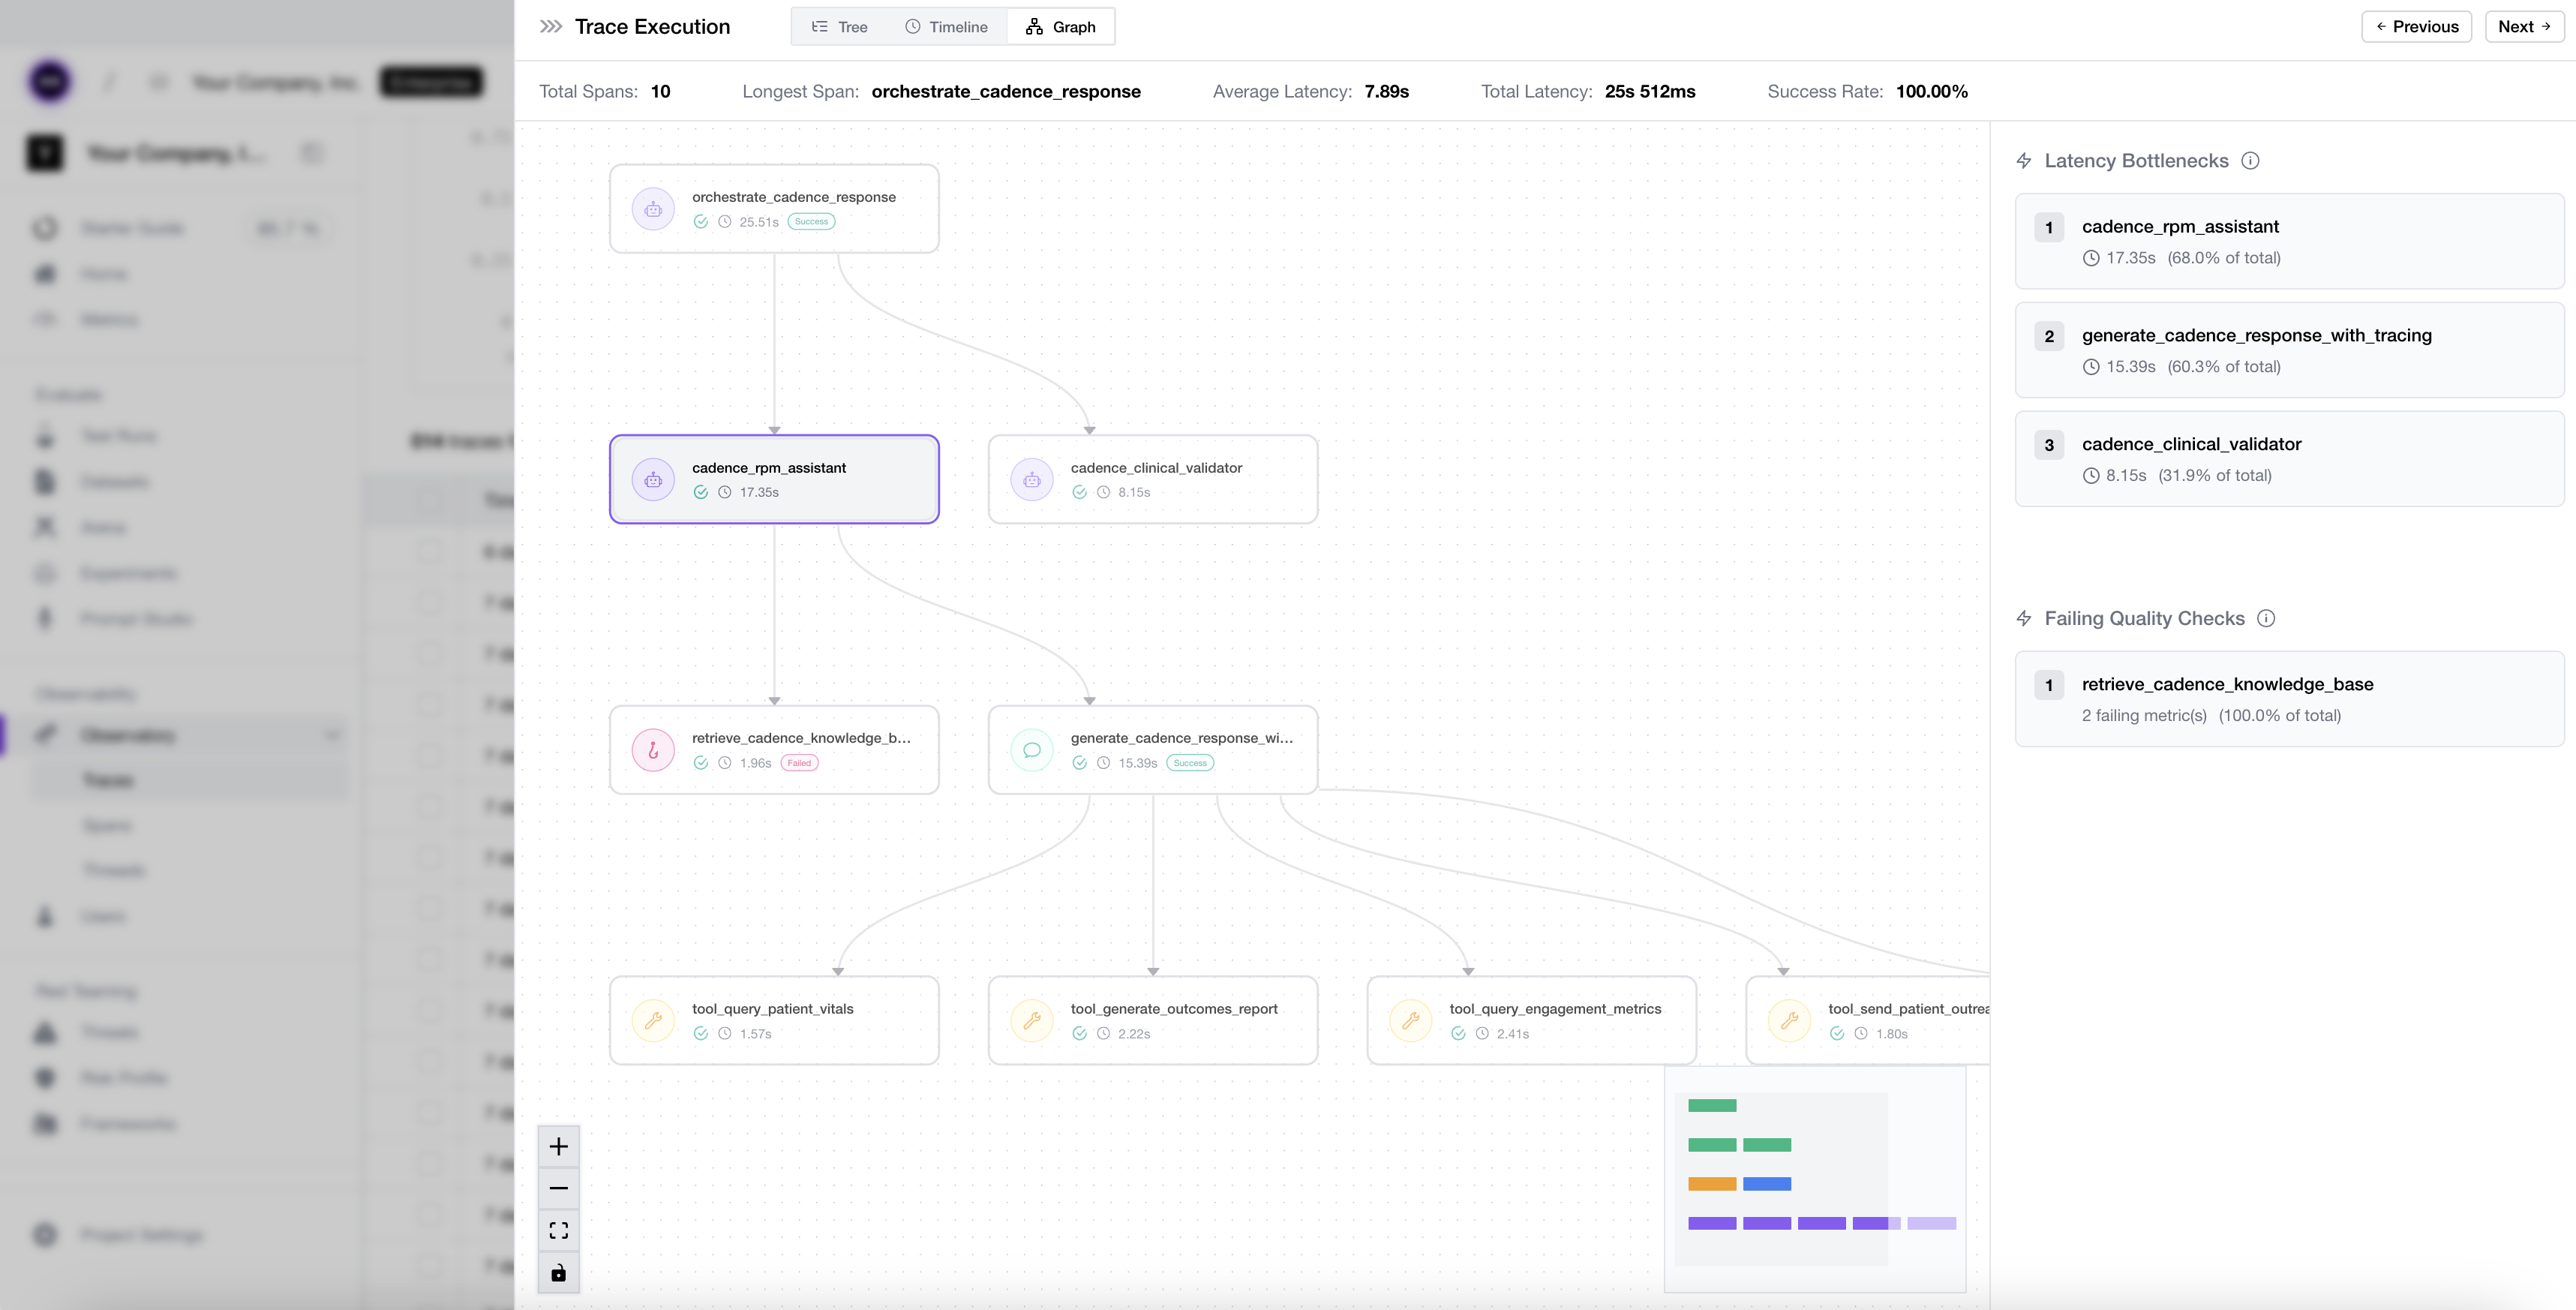 An agent trace graph showing how LLM, tool, and retriever spans nest under agent spans across a single run.
This typing is what makes targeted evaluation possible — a point we'll lean on heavily in the next section. Because retrieval is its own span, you can score it for context relevancy; because each tool call is its own span, you can score it for tool correctness, independent of whether the final answer happened to read well. That separation is exactly how you'd catch that Garry's policy retrieval was perfect while his refund call was wrong, instead of throwing up your hands at a vague "bad response."
Observability and Tracing Frameworks
Capturing all of those span types by hand sounds like a lot of work — but you don't have to build any of it from scratch, because the ecosystem standardized fast. Most platforms now build on or interoperate with OpenTelemetry (OTel), the open standard for traces, metrics, and logs, and that matters for one practical reason: portability. Instrument with OTel's GenAI semantic conventions — a community standard that now covers model calls, agent spans, and tool calls — and your traces aren't locked to a single vendor's backend.
In practice you'll land somewhere on a spectrum:
- OpenTelemetry GenAI conventions give you a vendor-neutral foundation, at the cost of more manual work.
- Framework integrations auto-instrument popular stacks — LangGraph, CrewAI, LlamaIndex, the OpenAI Agents SDK — so you get traces with no decorators at all.
- LLM-native SDKs capture LLM and agent spans with far less boilerplate and richer structure, and let you attach evals in the same step.
That last point is what couples tracing to evaluation, and it's the bridge into the next section — it's also exactly the coupling that would have caught Garry. The most useful SDKs let the decorator that creates a span also evaluate it: you attach a metric like answer relevancy or tool correctness at instrumentation time, and the span is scored the moment it's recorded, with no separate eval pipeline to wire up. Many teams use OTel as the transport layer and an LLM-native SDK for the semantic richness on top — you don't have to choose just one.
AI Quality for the entire organization, not just individual teams
Give all AI use cases the same quality bar with all-in-one evals, observability, and red teaming, and enforce them at scale.
Evaluating AI Agent Performance
You can now capture every span of every run. Here's the catch: tracing only tells you what happened, not whether it was any good. A trace records a wrong answer as calmly as a right one — Garry's bad refund would have sailed through a fully-traced system without tripping a single alarm. Observability without evaluation is just expensive logging. Evaluation is the layer that runs on top of your traces, scoring spans and final outputs against metrics you define, and it's what turns a recording into a judgment.
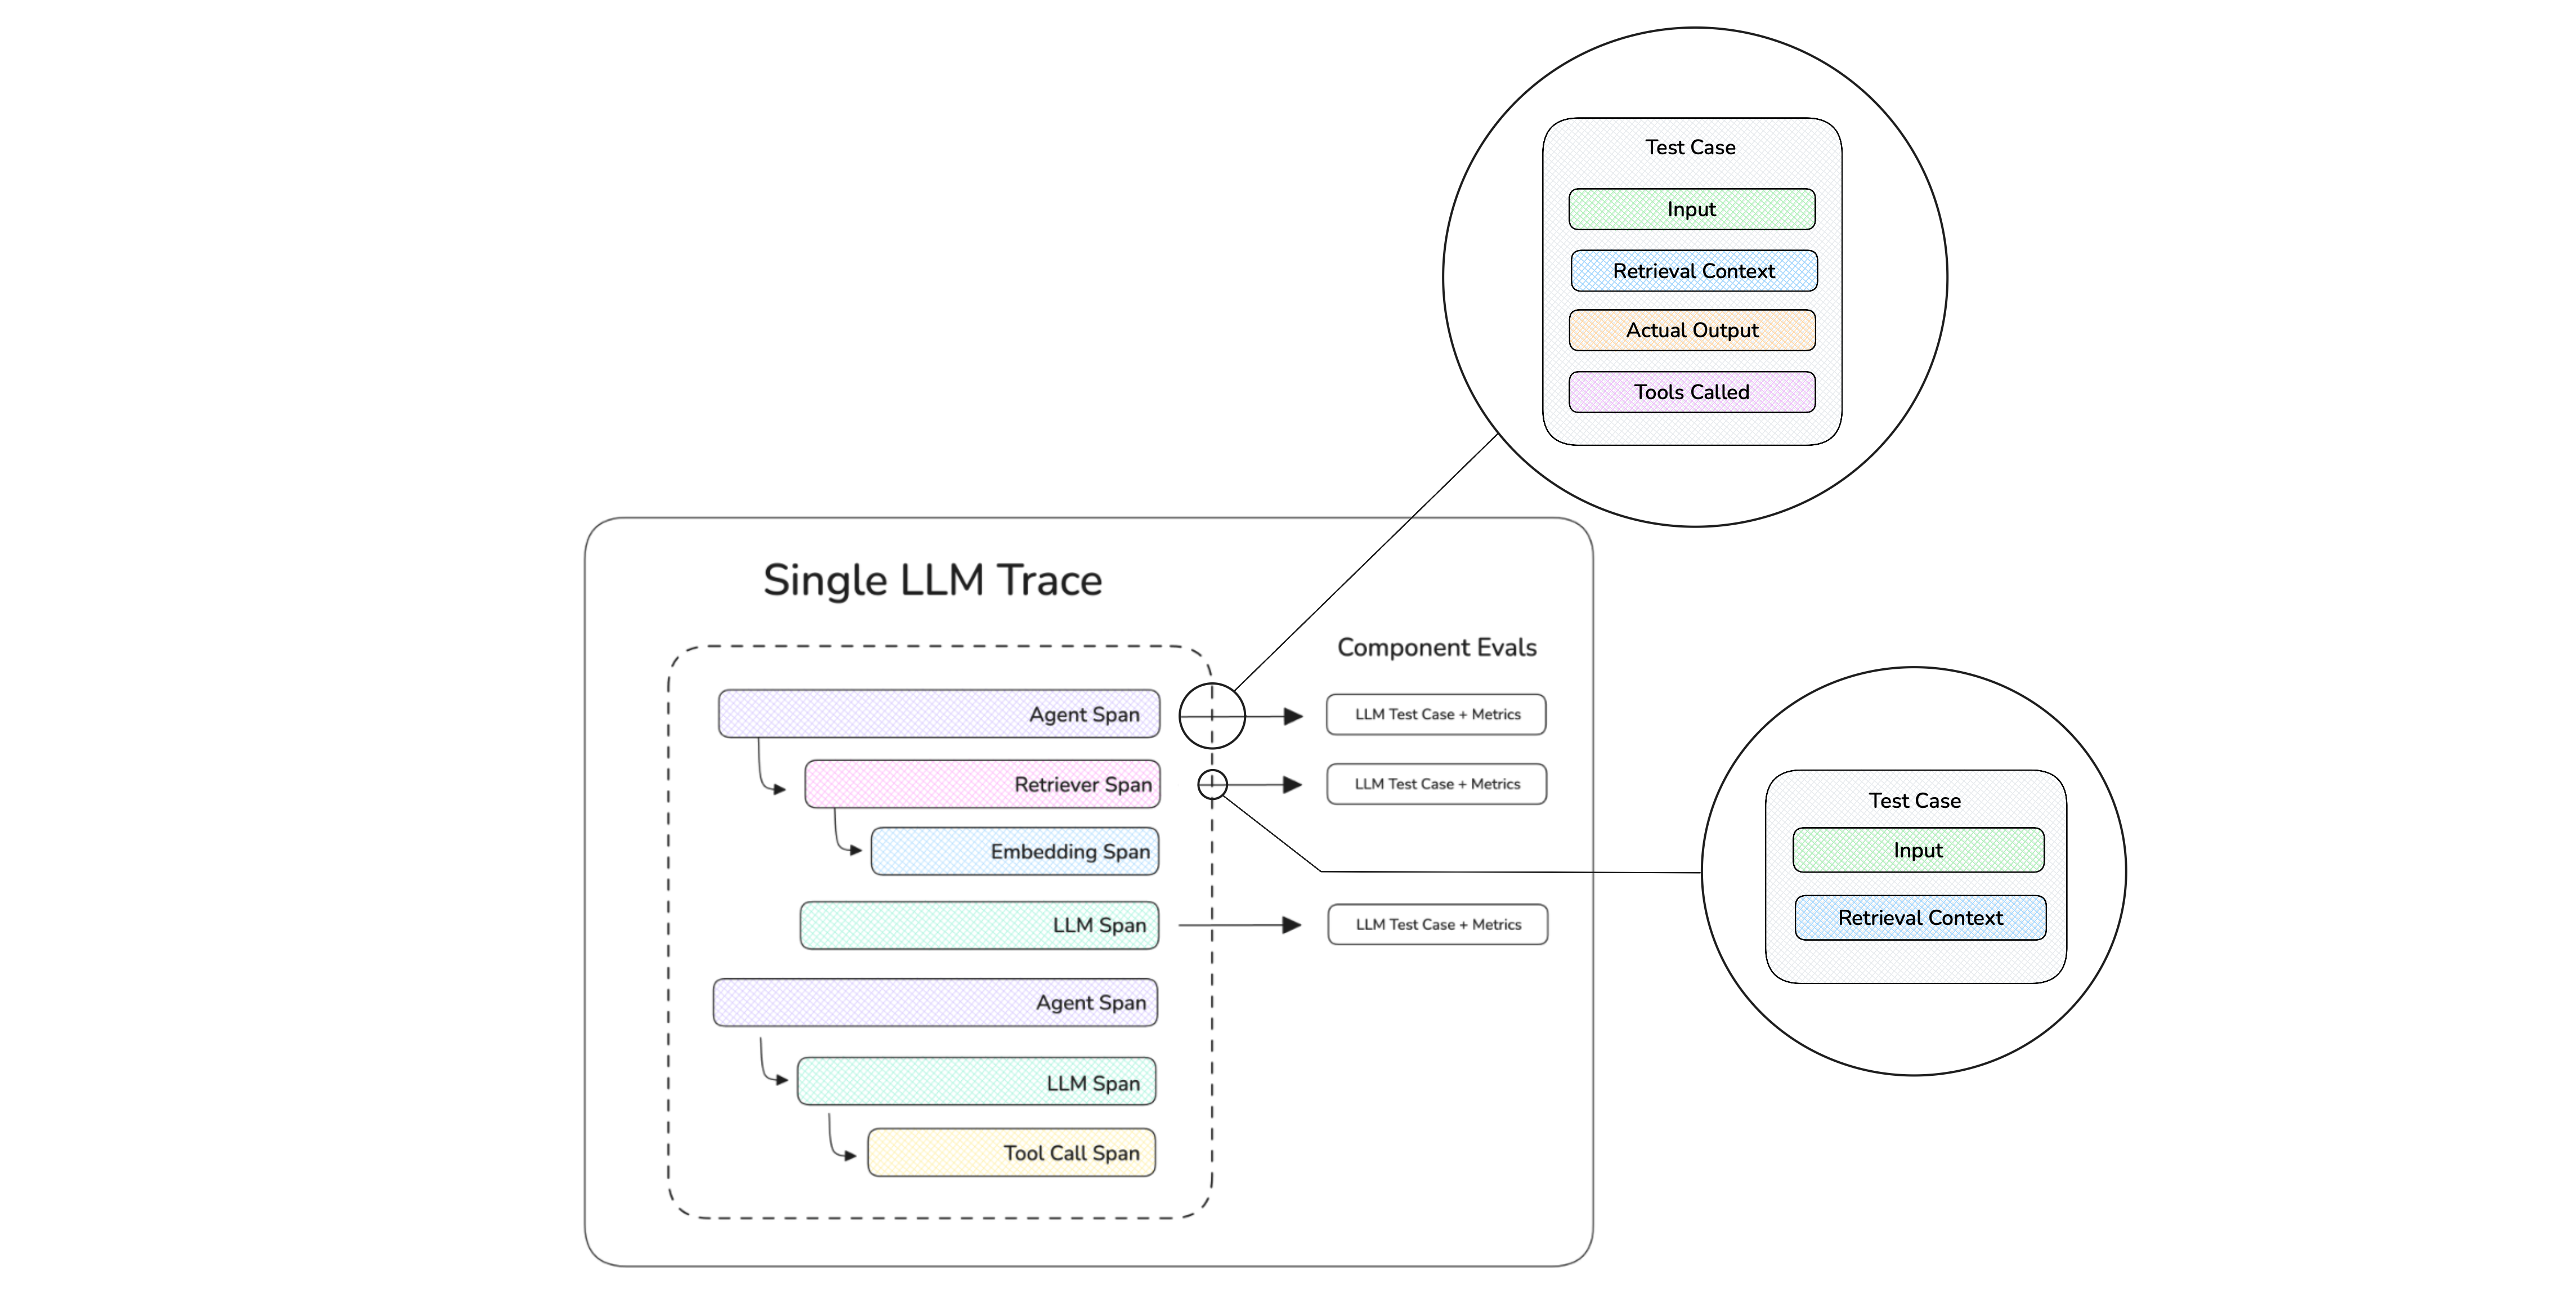
Evaluation metrics applied at the span (component) level, so you can measure tool correctness, retrieval relevancy, and answer quality independently.
(For the full menu of agent metrics, see the AI agent evaluation guide. Here I'll focus on how evaluation slots into observability.)
Types of Evals
The first thing to settle is what altitude you evaluate at, and you need two.
An end-to-end eval judges the agent's final answer against the user's request — was it relevant, correct, faithful, did it complete the task? But "wrong" isn't actionable on its own, which is why you also need component-level evals that score individual spans: tool correctness on a function call, context relevancy on a retrieval, argument correctness on the inputs. (This is exactly the span typing from the previous section paying off.)
The relationship between them is the whole point. End-to-end evals catch that something is wrong; component-level evals tell you where. For Garry, an end-to-end eval says "the customer was harmed," while a component eval narrows it to "the refund tool fired with a bad argument though retrieval was fine" — the difference between knowing you have a problem and knowing how to fix it. Run end-to-end evals on everything, and add component evals to the spans where failures cluster.
Online vs. Offline Evaluations
End-to-end versus component-level is what you measure. The other axis is when you measure it.
Offline evaluation | Online evaluation | |
|---|---|---|
Runs on | A fixed dataset | Live production traffic |
When | Before deployment (CI/CD, experiments) | After deployment, continuously |
Purpose | Catch regressions before users do | Catch drift and real-world failures |
Ground truth? | Usually yes (expected outputs) | Usually no (reference-free metrics) |
These two aren't competitors — they're the two ends of one loop. No offline dataset contained "user asks about invoice #4471," so only an online eval scoring live traffic could have caught Garry's bad refund as it happened. But once caught, that exact case becomes a fixed entry in the offline dataset, so the next version has to handle it before shipping. Online catches what you didn't foresee; offline makes sure it never bites you twice — a loop we'll come back to and complete in the final section.
Signals
Notice what every eval so far quietly assumes: that you already know what to measure. But you can only write a metric for a failure mode you've anticipated — and agents fail in ways you never imagined. A metric you never defined will never fire, no matter how bad the behavior. That's the gap signals fill: they surface the issues you didn't write a metric for, so you know what to evaluate next.
Some signals are just the metrics you already run:
- Quality — answer relevancy, faithfulness, task completion, tool correctness.
- Safety — toxicity, PII leakage, prompt-injection susceptibility.
But the most valuable signals are the ones you didn't think to define — emerging topics, sentiment drops, recurring complaints, brand-new use cases, or a sudden spike in one error type (a cluster of wrong refunds, say) — surfaced automatically from production traffic.
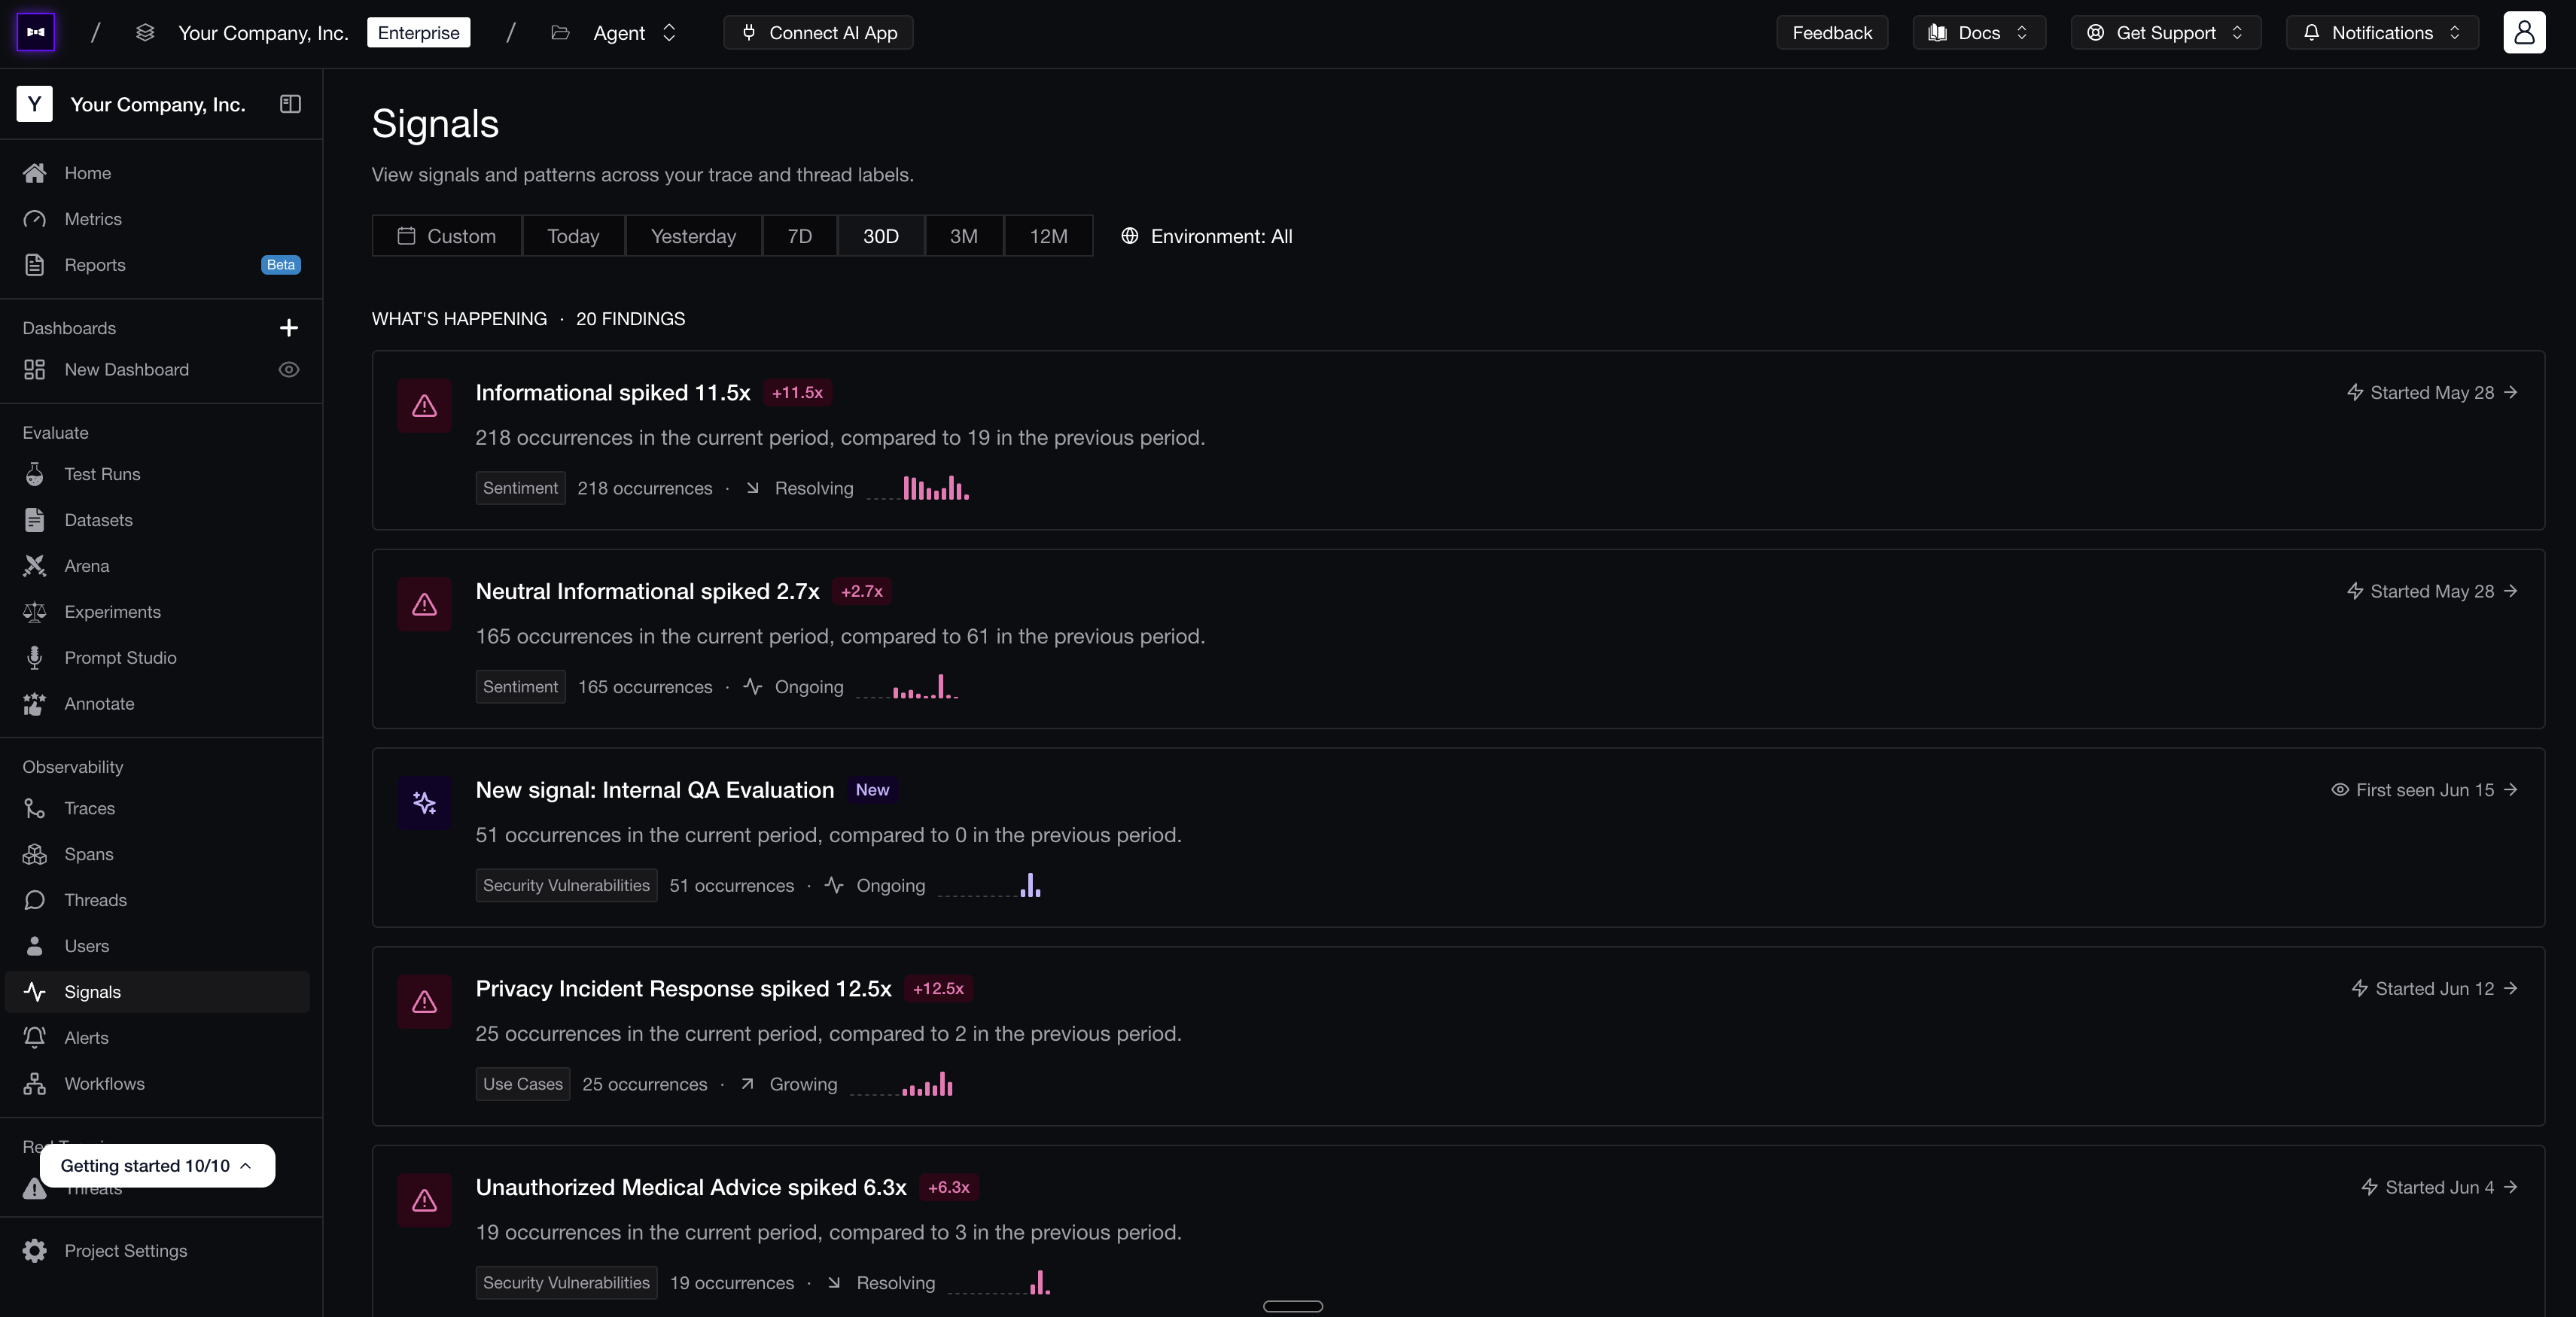 Production signals surfaced automatically — sentiment spikes, new use cases, and safety issues — each tied back to the traces that produced them.
So the relationship is simple: a metric confirms a failure you predicted; a signal reveals one you didn't. Every new signal is really a prompt to write the next metric, which is how your evaluation suite keeps pace with an agent that's constantly meeting inputs you never tested. (Notice what's missing from this list, though — cost and latency. Those aren't quality signals at all, which is exactly why they need a different home, coming up next.)
Guardrails and Threat Detection
Evals and signals share one limitation: they both happen after the fact. That's perfect for learning, but useless for stopping harm in the moment. That's the job of guardrails — checks that run in the request path and can block, rewrite, or flag a response before it reaches the user or before a tool executes.
- An input guard catches prompt injection — the number-one risk in the OWASP Top 10 for LLM Applications — or out-of-scope requests before the agent acts on them.
- An output guard catches PII leakage, toxicity, or hallucinations before they're returned.
- A tool guard verifies that a sensitive action — a refund, a delete, an email send — is actually allowed before it runs.

Input and output guards wrap the agent, blocking unsafe requests and responses in real time before they reach the user or a tool.
A tool guard is precisely what stops a dangerous action from misfiring — confirming an invoice belongs to the customer before any money moves, which is exactly what would have caught Garry's refund. Guardrails block the attacks you've anticipated; finding the ones you haven't is the job of adversarial red teaming — deliberately probing the agent with jailbreaks, injection payloads, and malformed inputs before it ships, so every weakness you uncover becomes a new guard and a new eval case instead of a production incident. And guardrails and observability reinforce each other: guardrails block the bad thing in real time, while observability records that it happened so you can see how often you're under attack and tighten the agent over time. For the deeper version, see the LLM guardrails guide.
Monitoring Agents in Production
Evals, signals, and guardrails all speak to whether the agent is good and safe. None of them speak to what it costs. An LLM judge will happily score a response for faithfulness, but it has nothing to say about the two numbers your finance team and your PMs actually run the product on — cost and latency — and a single per-trace score, however accurate, isn't the tangible, aggregate picture a business needs to make decisions on.
That's the shift production monitoring makes: from inspecting one trace to watching thousands, and from pure quality to the operational metrics that sit right beside it. Good monitoring tracks both — the failure modes your evals surface and the cost, latency, and throughput numbers that are central to the company — so the agent's quality and its bill show up on the same screen. It's increasingly expected of you, too: NIST's AI Risk Management Framework calls for AI to be tested "regularly while in operation," not just before launch, and the EU AI Act requires post-market monitoring for high-risk systems.
Cost Tracking and Latency
Start with the two metrics that ambush teams in production, precisely because agents fan out — one user turn can trigger many model and tool calls, so the bill scales with steps, not requests. The numbers worth watching:
- Cost per trace, thread, and user — to spot the conversations and customers that are quietly expensive.
- Cost per model — so you know where a cheaper model would actually save money.
- Latency by span — to tell whether the slowness lives in the model, the retrieval, or a sluggish external tool.
- Step count per turn — because a rising average is an early warning that the agent is starting to loop, the way Garry would if a tool result confused him.
User Analytics
Cost and latency are machine metrics, though, and machine metrics only tell half the story. Tying traces back to real user behavior is what tells you whether your quality scores actually translate into outcomes. A thumbs-down, an edit, or an explicit rating tied to the exact trace that caused it is a real-world label — the angry email about Garry's refund, for instance, is itself a ground-truth signal that the trace it's attached to was a failure. Beyond explicit feedback, signals like whether the ticket actually got resolved, where users drop off, and how often they escalate to a human turn a vague "quality" into something you can measure against the business.
Custom Alerts
By now you're collecting quality scores, cost, latency, and user feedback on every run — far too much to watch by hand. Monitoring only helps if it tells you something's wrong without you having to stare at a dashboard, and the trick is to alert on quality, not just uptime, because traditional monitoring will cheerfully report an agent as "healthy" the entire time it's producing wrong answers. Useful alerts fire when:
- An eval score like faithfulness or tool correctness drops below a threshold over a rolling window.
- Error, timeout, or guardrail-trigger rates spike.
- Cost or latency per turn blows past budget.
- A specific failure category starts trending up.
An alert on a rising refund-tool-error rate is the difference between catching Garry's bug in an hour and catching it in two days.
Custom Dashboards and Health Reports
Alerts catch the acute breaks. For everything else — the slow trends, the weekly review, the quarterly cost story — different people need different views of the same data, which is what makes custom dashboards worth the effort. Engineers want failure traces and latency breakdowns, product wants resolution rates and user feedback, leadership wants cost and quality trends, and forcing all of them through one generic view just means nobody looks.
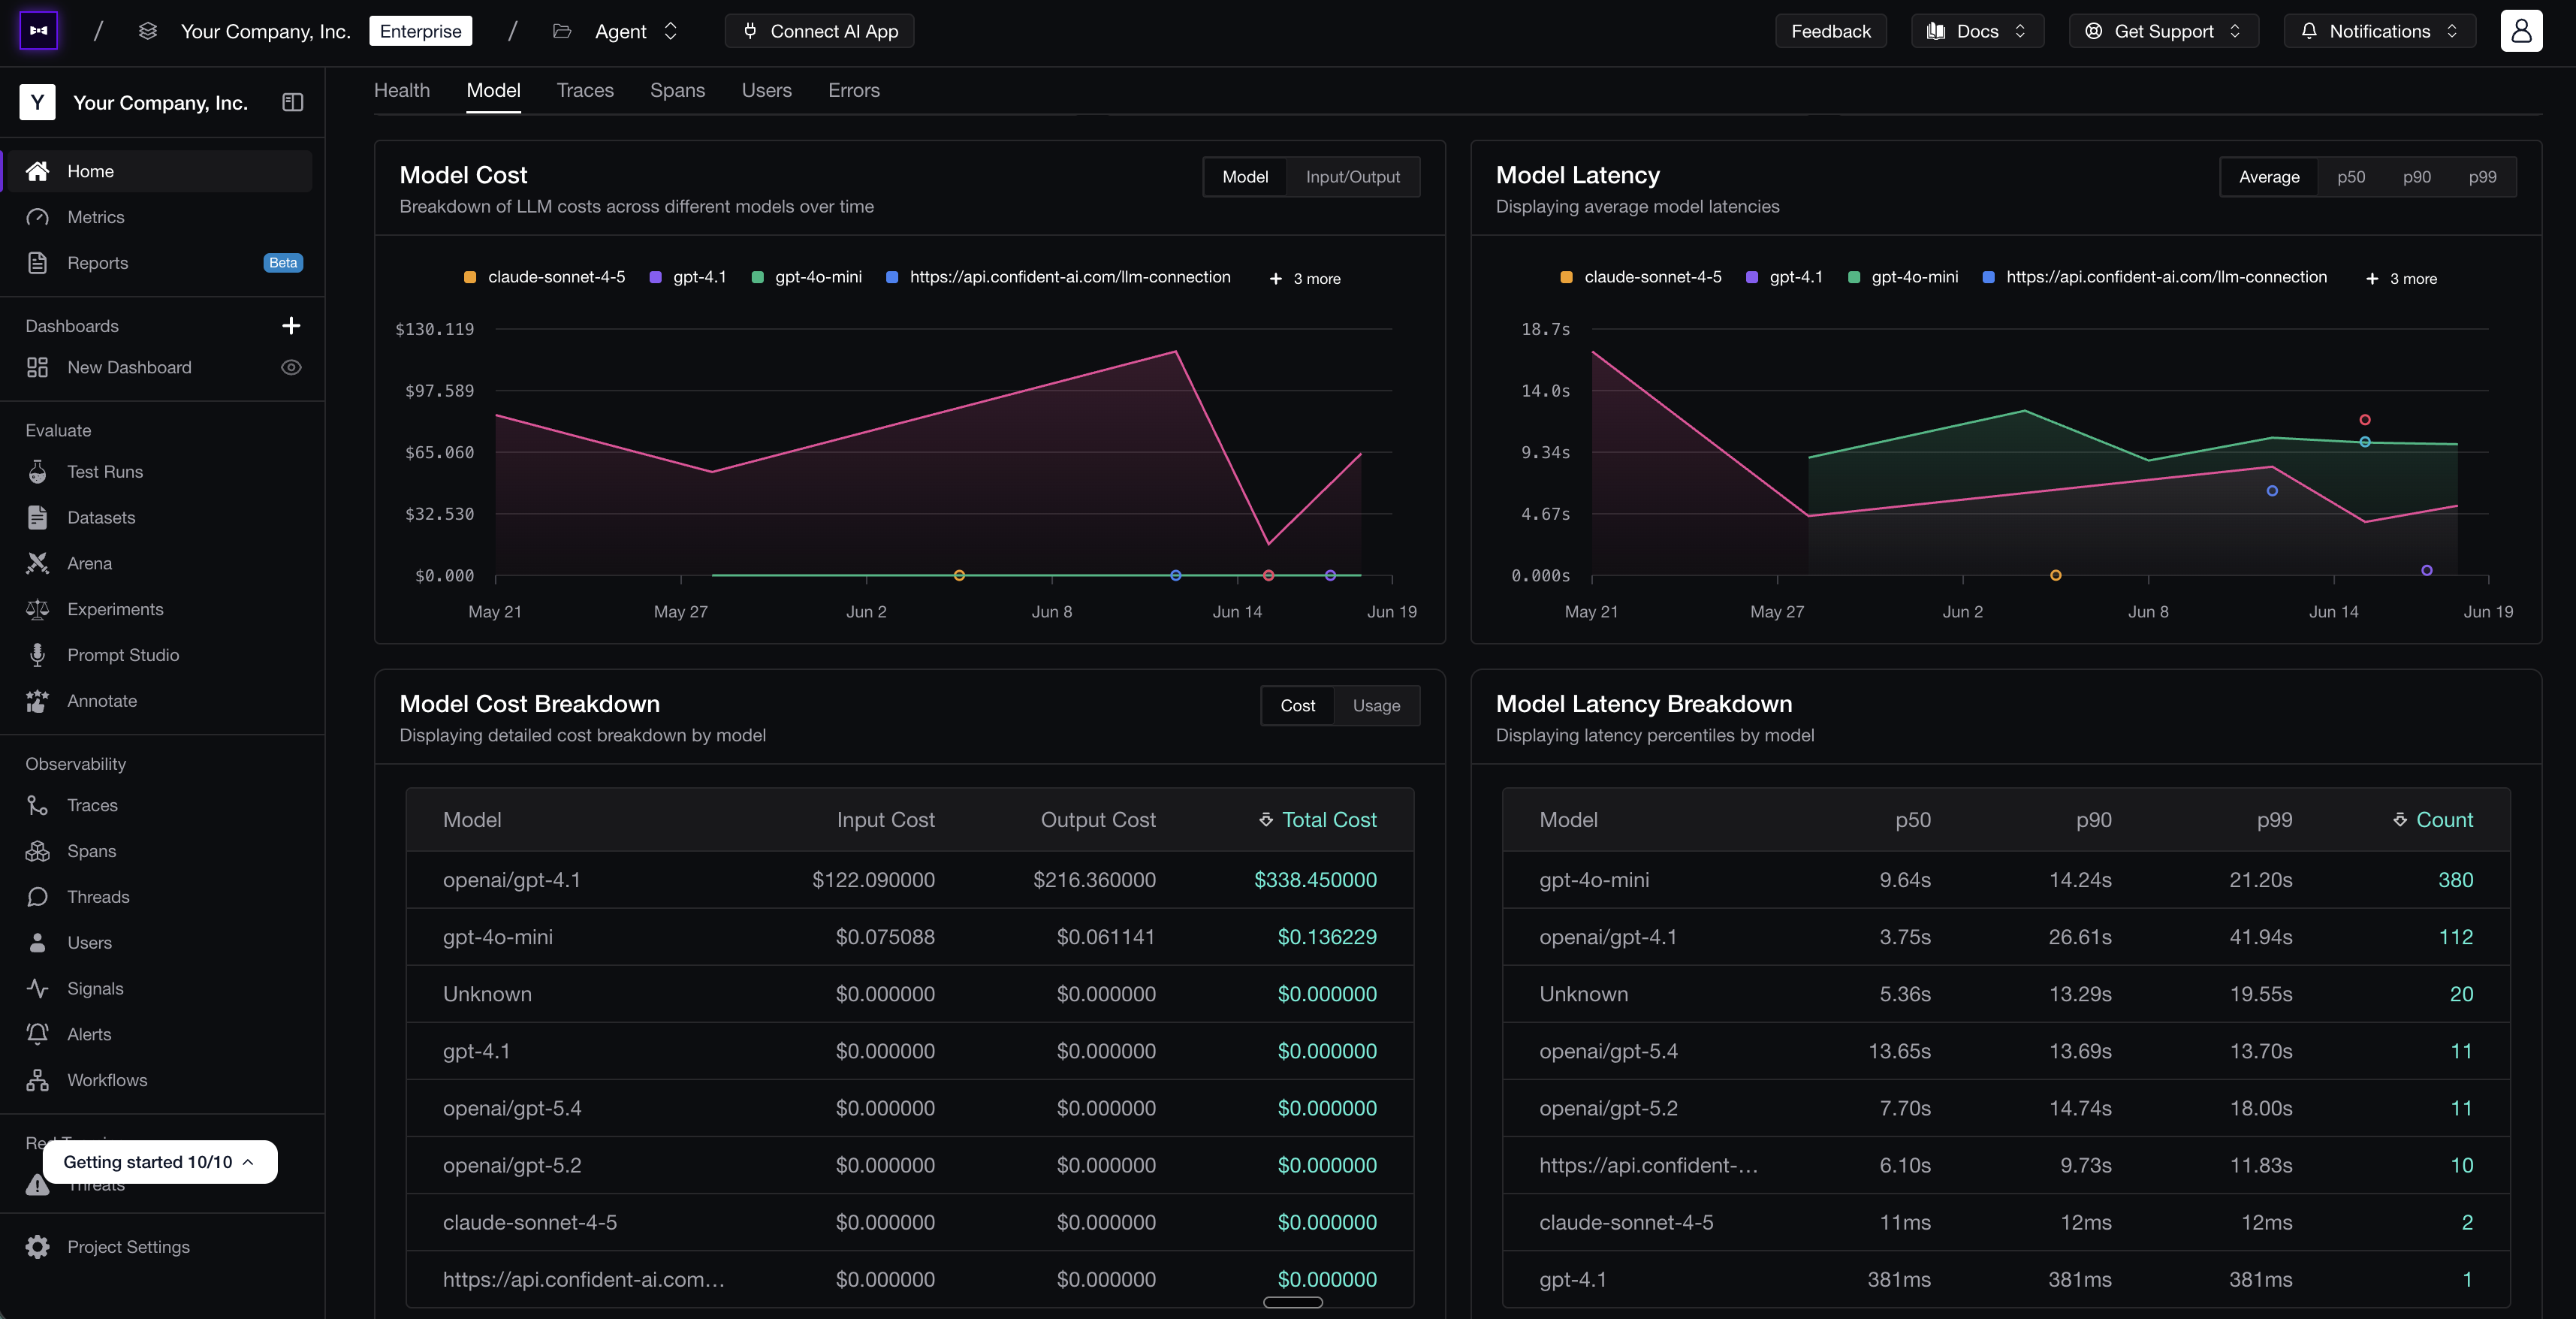 A custom dashboard tracking model cost and latency over time, with per-model breakdowns — the kind of view each team can tailor to itself.
A good weekly health report rolls the essentials together — quality trend, cost trend, latency trend, top failure categories, and which prompt and model versions shipped — so an incident like Garry's shows up as a line moving the wrong way that someone notices on Monday, rather than a surprise that detonates on Wednesday.
Improving Benchmarks: Closing the Feedback Loop
Here's the real payoff of all that monitoring: it hands you a list of failure modes you didn't know about at ship time. And the moment you discover one, you know something you didn't before — so the responsible thing is to fold it back into the benchmark you ship against, so you never re-ship a regression you've already seen. Within the scope of what you now know, that bug becomes impossible to repeat.
This is the part most teams skip, and it's the part that actually matters. Tracing, evals, and monitoring are all inputs — the only output that justifies them is a better agent. Closing the loop means a production failure like Garry's doesn't just get logged and forgotten; it systematically becomes a permanent entry in your evaluation set.
Human Annotations and Metric Alignment
The loop starts with a humbling fact: automated metrics are proxies for human judgment, and proxies drift. The way you keep them honest is human annotation — having reviewers label a sample of traces, then comparing those labels to what your metrics said. Wherever a human and a metric disagree, you've found a metric you can't yet trust, and the fix is to tune its criteria, threshold, or judge prompt until it agrees with your experts.
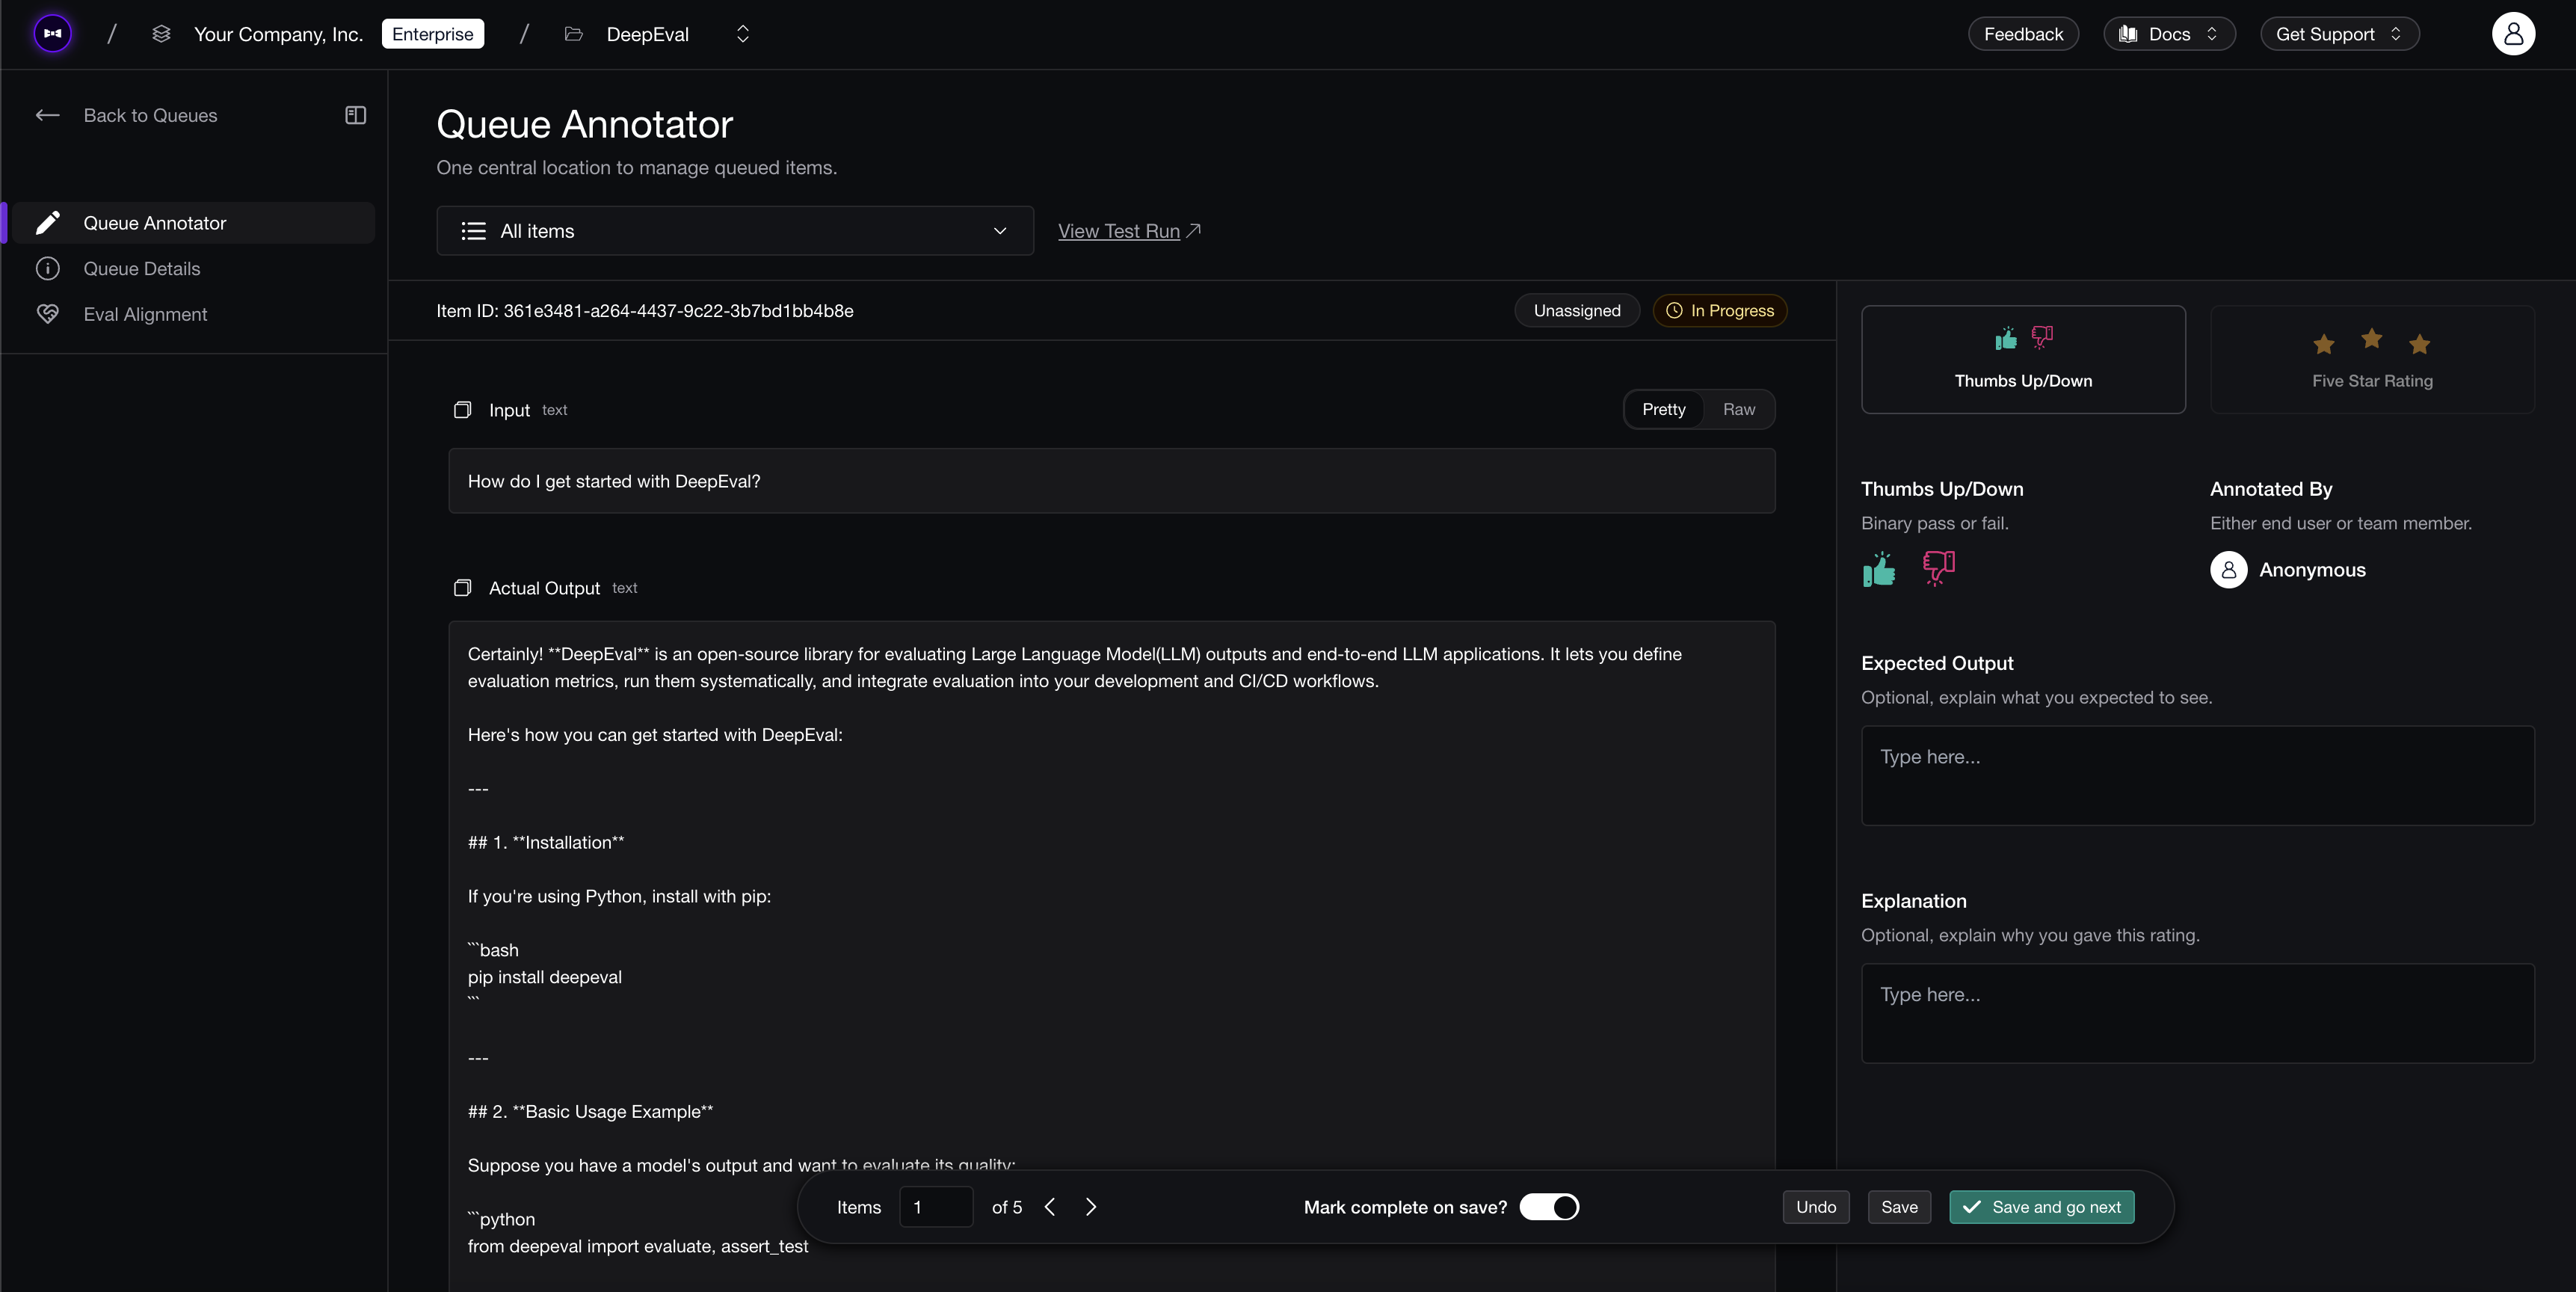 An annotation queue where reviewers label production traces, feeding metric alignment and dataset curation.
This is metric alignment, and it's what eventually makes it safe to let an online eval gate sensitive actions on its own. If a reviewer flags Garry's refund as a clear failure but the tool-correctness metric passed it, that disagreement is the signal to sharpen the metric — so next time, the automation catches what the human would have. I went deep on this in the human-in-the-loop AI agent evaluation guide.
Trace-to-Dataset Loops
Those human annotations do more than fix your metrics — each labeled trace is also a data point you'll never get from a synthetic test. Which is the whole idea here: your best evaluation dataset isn't something you write up front, it's your own production traffic. Every interesting trace is a candidate test case, and the failures are the most valuable of all. The loop is simple:
- A production trace fails an online eval (or a customer flags it).
- A reviewer confirms it's a real failure and labels the expected behavior.
- That trace — input, retrieved context, and correct expected output — becomes a permanent case in your offline dataset that every future version must pass.
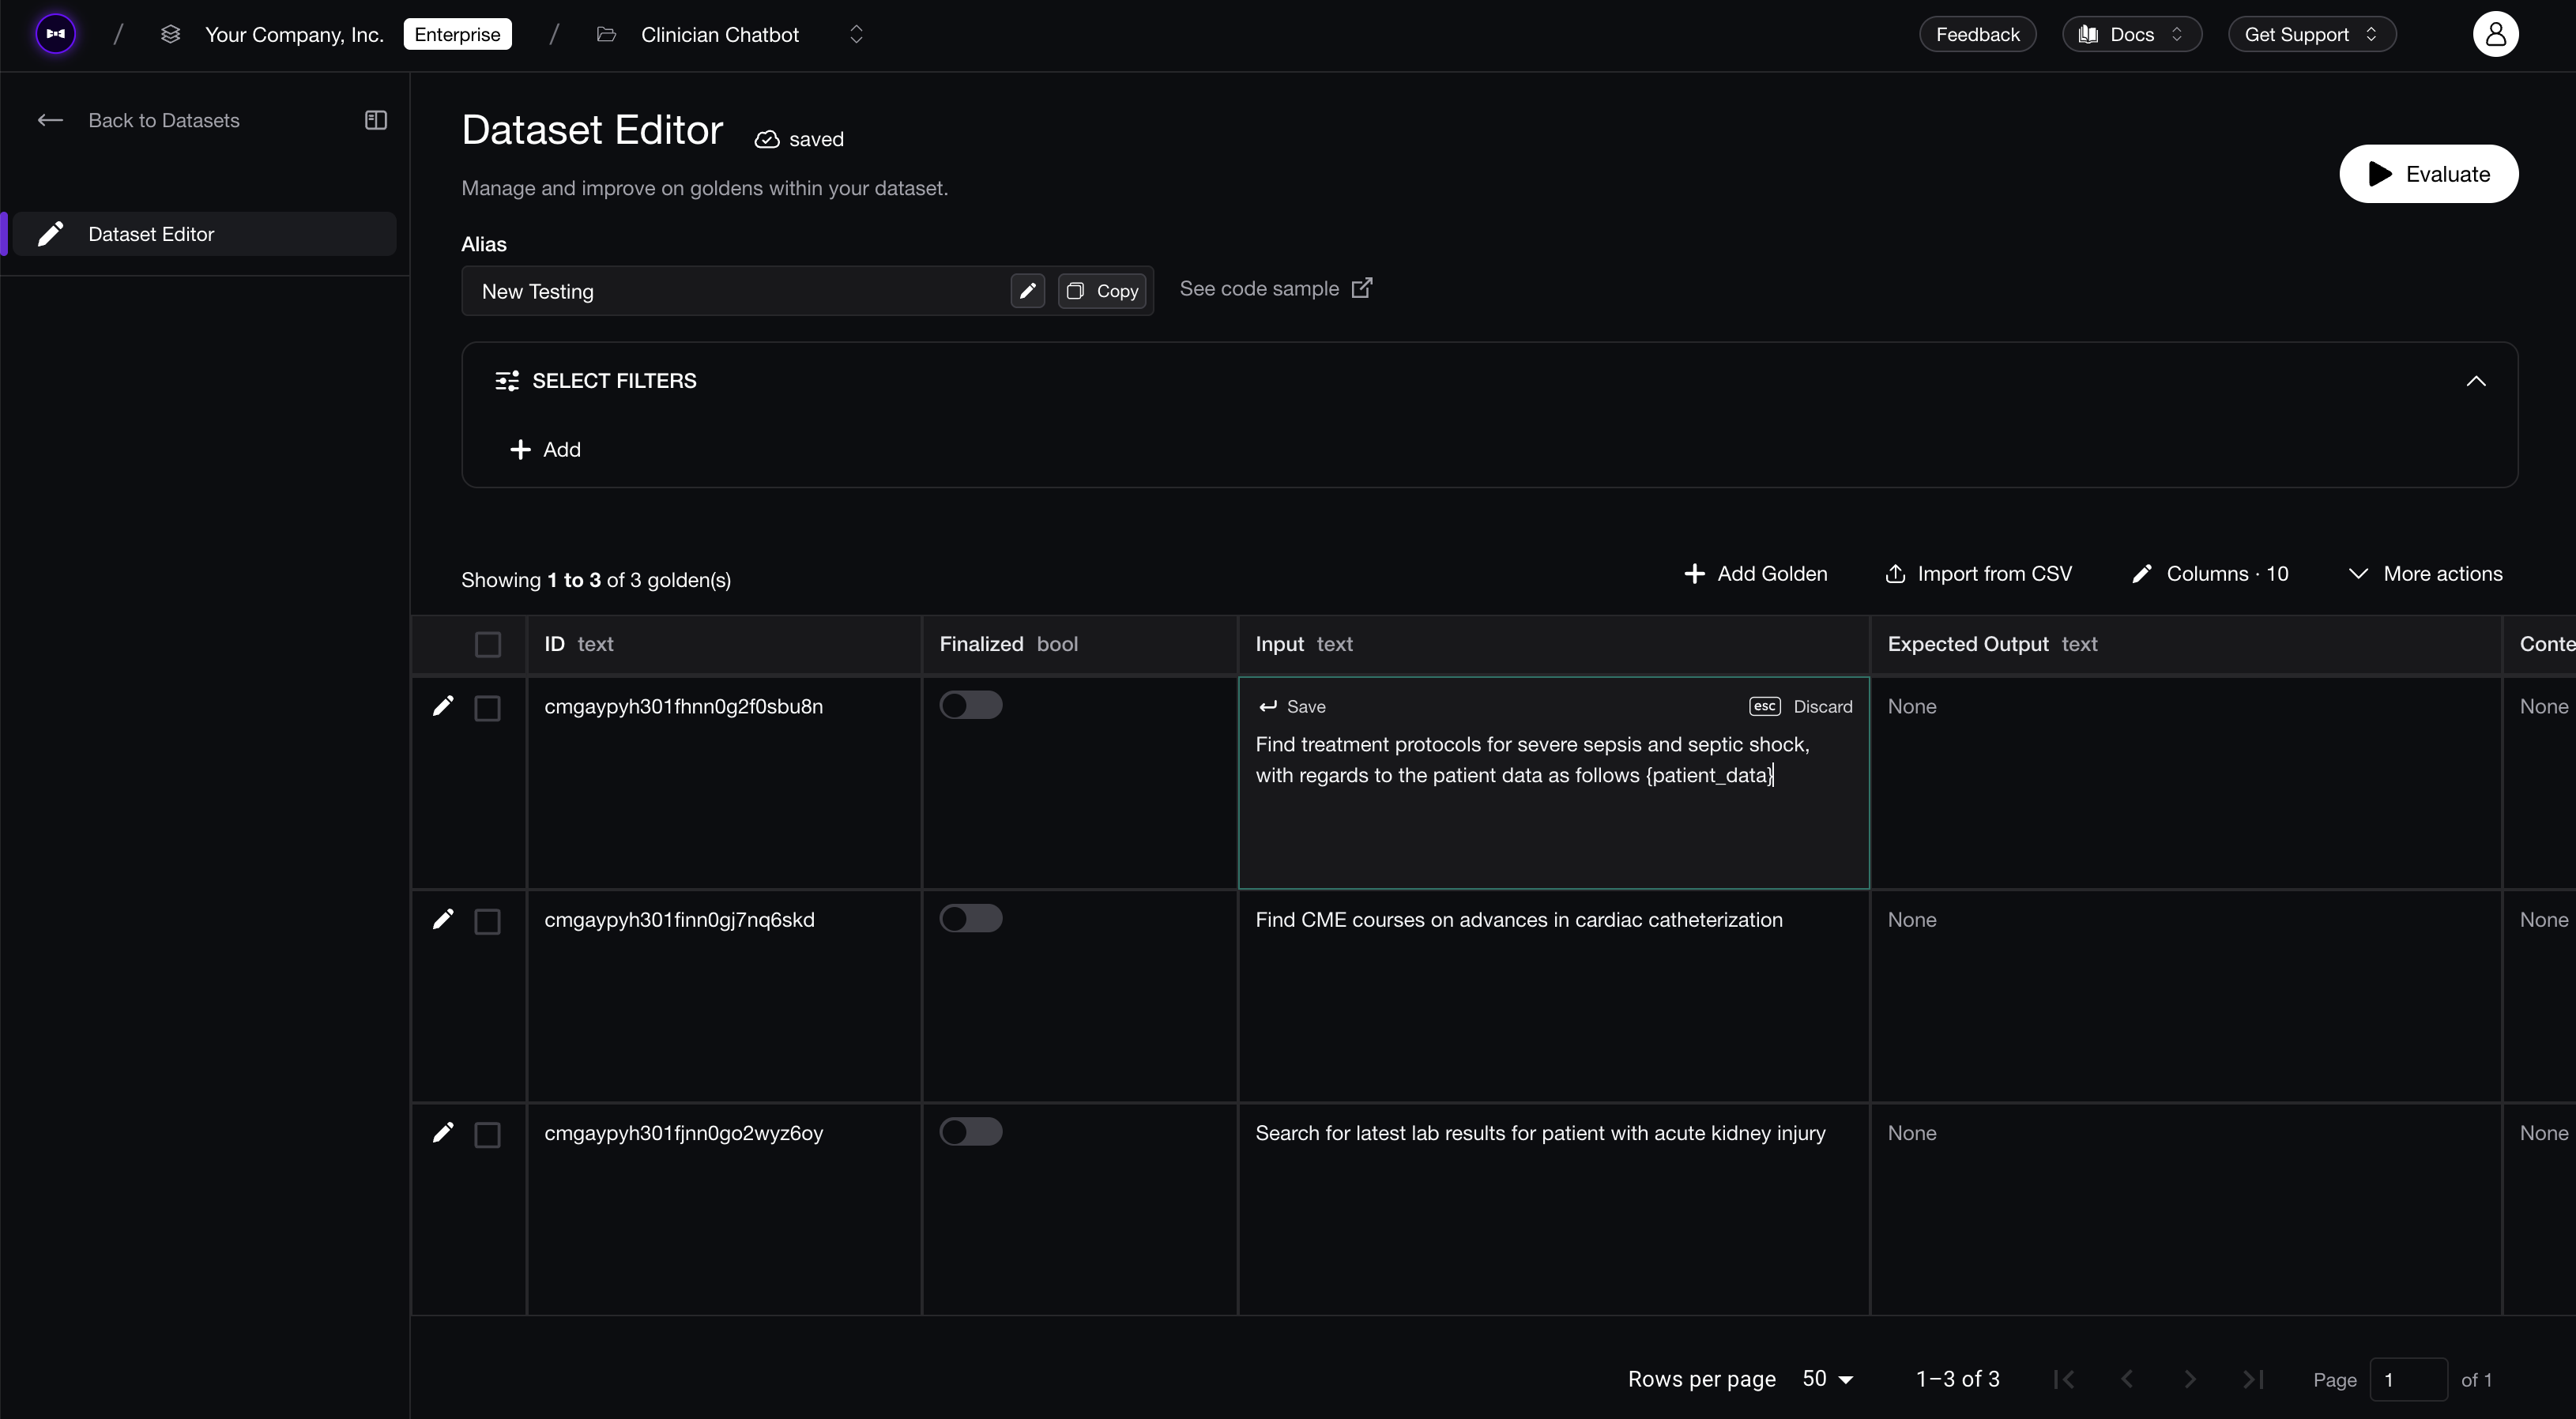 Promoting a reviewed production trace into a curated evaluation dataset, turning a one-off failure into a permanent regression test.
That's what makes the system compound, and it's the same online-to-offline loop from the evaluation section finally closing. Garry's refunded-the-wrong-invoice trace stops being an embarrassment and becomes a regression test that quietly protects you forever — so no prompt or model change can reintroduce that bug without failing CI first.
Automated Workflows
Annotating, aligning, and promoting traces by hand works right up until your volume grows — and then it doesn't. So the last step is automating the toil out of the loop, because the repetitive parts shouldn't depend on someone remembering to do them. The highest-leverage automations:
- Auto-surface failures — flag the traces that fail online evals, trip guardrails, or draw negative feedback, so reviewers spend their attention on the worst cases instead of sampling at random and hoping to stumble on the next refund bug.
- Auto-route reviews — send cases to the right reviewers by category or severity.
- Schedule evals — run them on a cadence so drift gets caught even when nothing obviously broke.
- Auto-promote confirmed failures into datasets, without manual copy-paste.
The goal isn't to remove humans; it's to spend their judgment only where it's genuinely needed, and let the loop run itself everywhere else.
Conclusion
Strip away the traces, spans, and dashboards, and AI agent observability comes down to one question you should be able to answer with confidence: is my agent actually good, and is it getting better? Garry couldn't answer that on the Tuesday he refunded the wrong invoice — and without the loop, neither could you.
And notice how the pieces hand off to each other. Tracing lets you see each step. Evaluation tells you whether what you saw was any good. Monitoring adds what it costs and watches it across thousands of runs. And the feedback loop takes everything you discover and folds it back into the benchmark, so every production failure leaves the next version stronger than the last.
That's the difference between an agent that fails twice and an agent that improves in production — and it's exactly the loop Confident AI is built around. Tracing, evals, monitoring, guardrails, and human review live in one place, running the same metrics in CI and in production, so catching a failure and preventing the next one is a single continuous motion.
Thanks for reading. When you're ready to put this loop into practice on your own agent, get started with Confident AI for free.
Frequently Asked Questions
What is AI agent observability?
What is the difference between tracing, monitoring, and observability?
What are traces, spans, and threads?
What are the types of AI agent spans?
What is the difference between online and offline evaluation for AI agents?
Do I need OpenTelemetry for AI agent observability?
How do I debug a failing AI agent?
What is the difference between evals, signals, and monitoring?
How do I close the feedback loop in AI agent observability?
What is the best AI agent observability tool in 2026?
Do you want to brainstorm how to evaluate your LLM (application)? Ask us anything in our discord. I might give you an "aha!" moment, who knows?
AI Quality for the entire organization, not just individual teams
Give all AI use cases the same quality bar with all-in-one evals, observability, and red teaming, and enforce them at scale.