Let There Be Light (Mode)
TGIF! Thank god it’s features, here’s what we shipped this week:
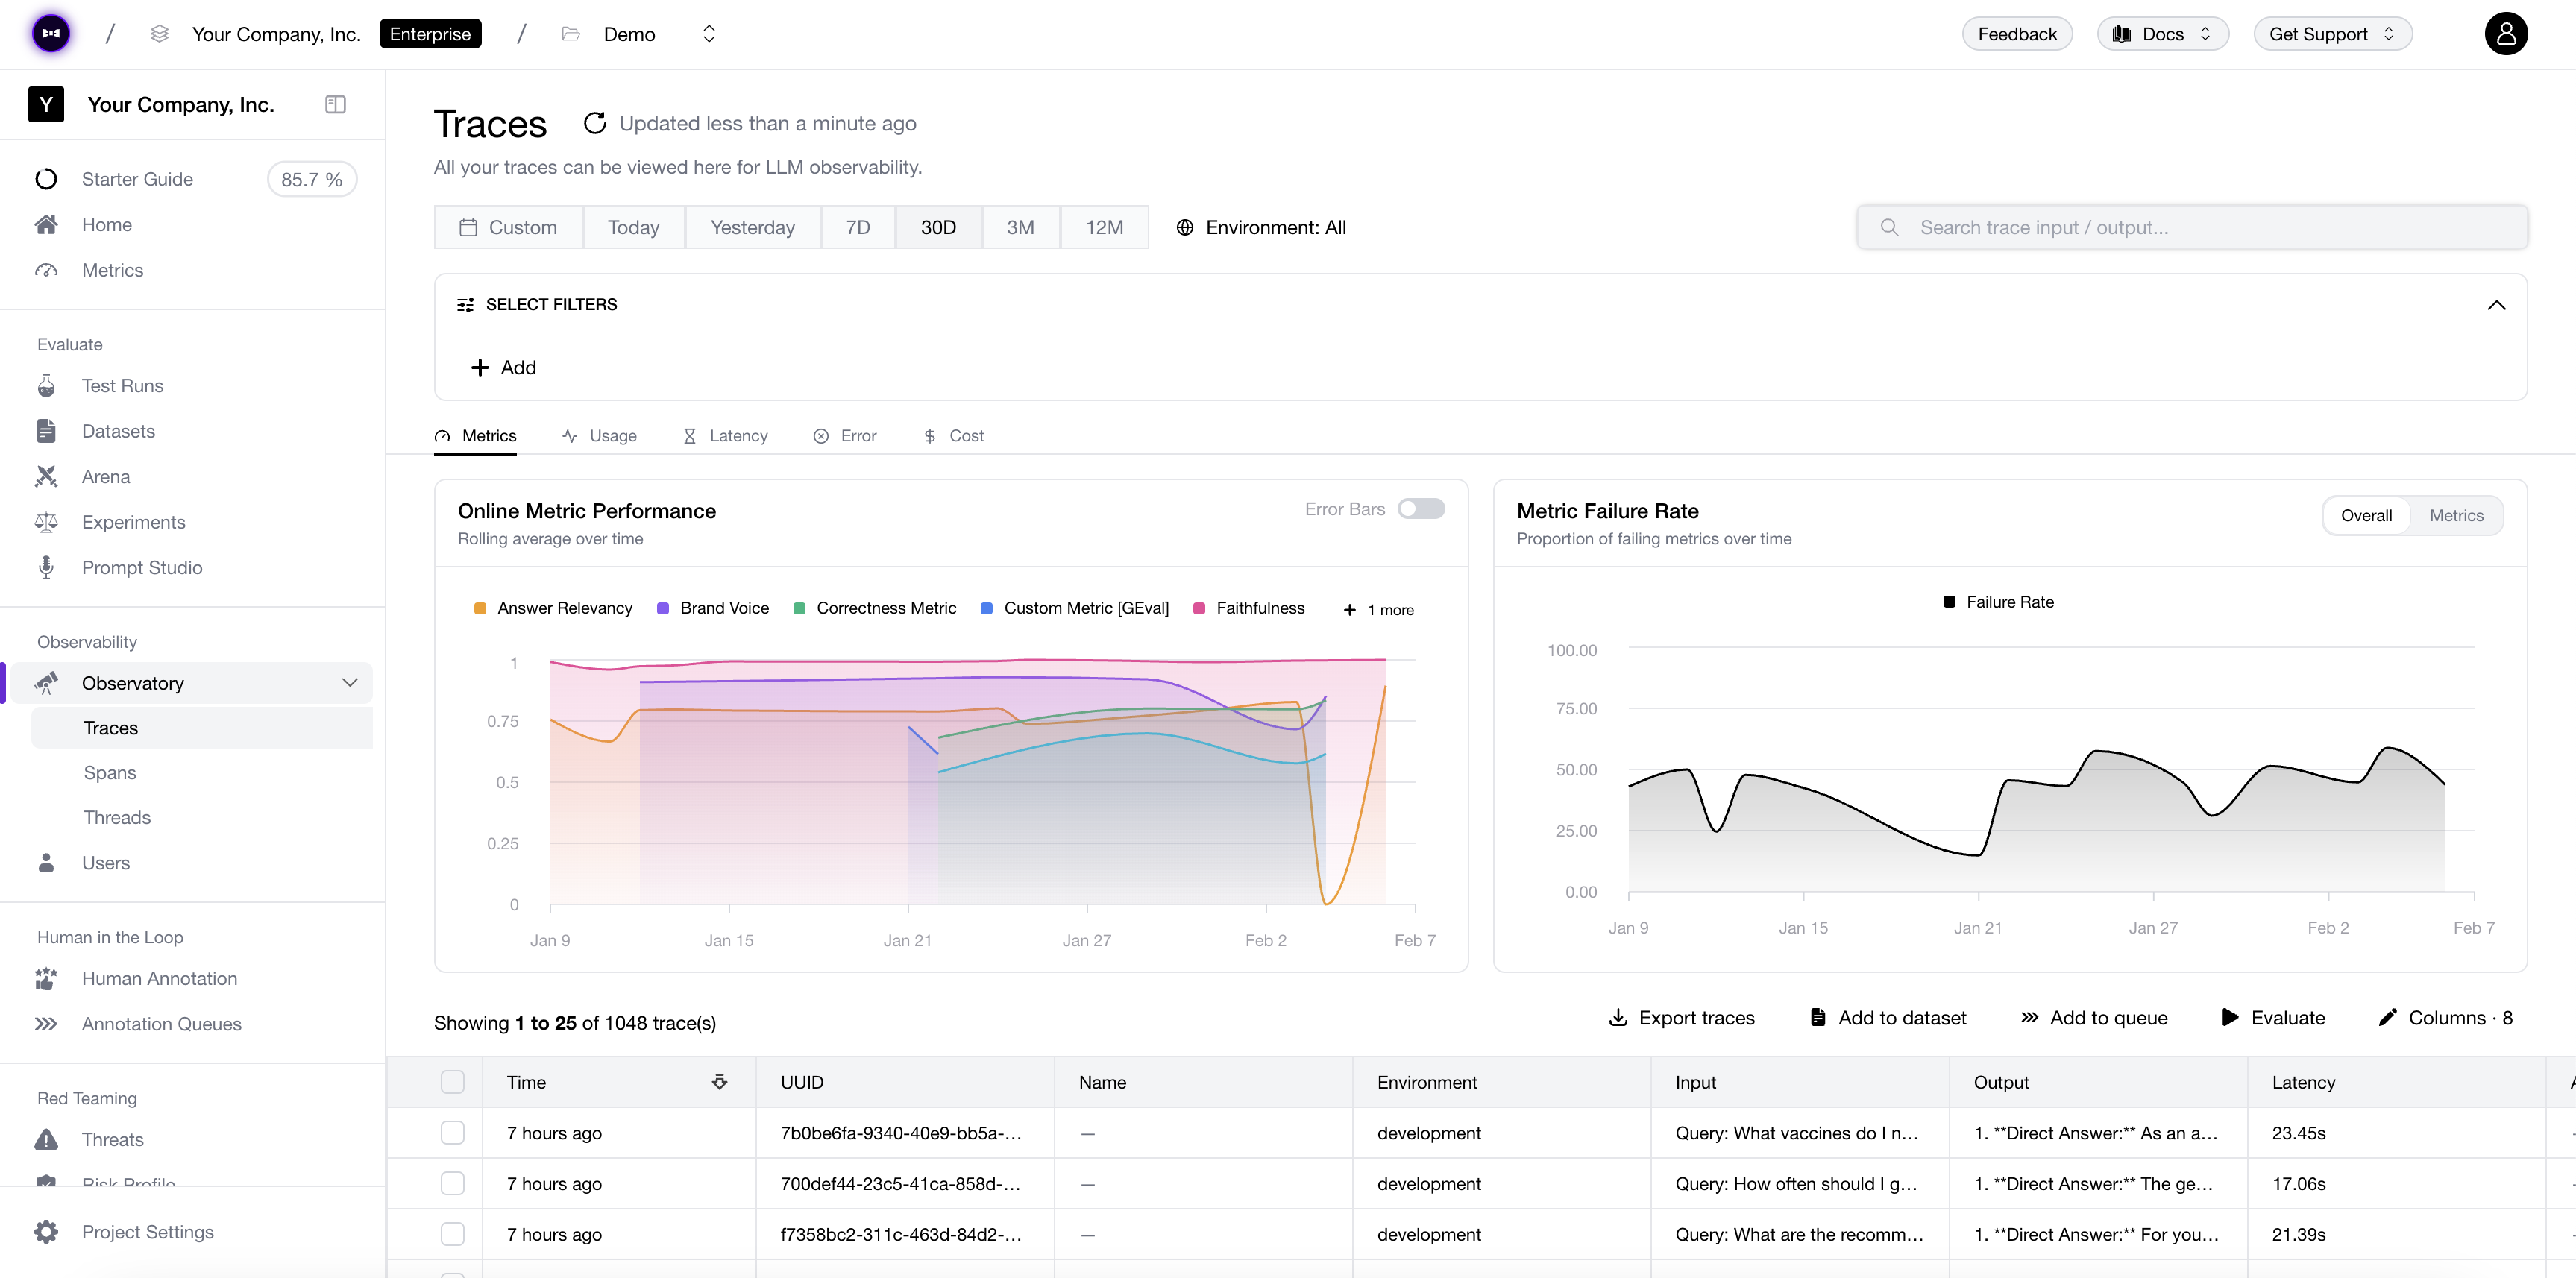
Big week for visibility—both in your data and on your screen. We’re launching 30+ additional Observatory graphs to surface insights, a Data Usage settings page for full transparency, and light mode is officially out of beta. Shine bright, friends.
Added
- Data Usage Settings Page - Know thy data. A dedicated page to see exactly how your data is being used—because transparency isn’t just a buzzword, it’s a lifestyle.
- Observatory Graphs - Finally, charts that slap. Visualize your observability data, spot trends before they spot you, and look like a genius in your next standup.
- Code Evals (Beta) - G-Eval couldn’t cut it? Write your own eval logic in code. We don’t judge. Okay, technically we do—that’s the whole point.
- Multimodal Arena - Let your vision-language models duke it out. Two models enter, one model leaves with bragging rights.
- AI Connection Upgrades - Tracing, list indexes key path, duplicate connections, max concurrency—the works. Your AI connections just got a glow-up.
Changed
- Light Mode Out of Beta - Light mode is officially here to stay. Welcome to the bright side.
- Faster Observatory Dashboards - We gave our dashboards a double espresso. Load times are now unreasonably fast.